

Inequalities in the burden of non-communicable diseases across European countries: a systematic analysis of the Global Burden of Disease 2019 study
- PMID: 37507733
- PMCID: PMC10375608
- DOI: 10.1186/s12939-023-01958-8
Inequalities in the burden of non-communicable diseases across European countries: a systematic analysis of the Global Burden of Disease 2019 study
Abstract
Background: Although overall health status in the last decades improved, health inequalities due to non-communicable diseases (NCDs) persist between and within European countries. There is a lack of studies giving insights into health inequalities related to NCDs in the European Economic Area (EEA) countries. Therefore, the aim of the present study was to quantify health inequalities in age-standardized disability adjusted life years (DALY) rates for NCDs overall and 12 specific NCDs across 30 EEA countries between 1990 and 2019. Also, this study aimed to determine trends in health inequalities and to identify those NCDs where the inequalities were the highest.
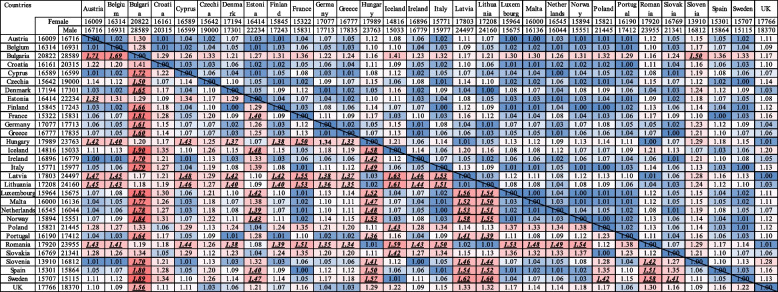
Methods: DALY rate ratios were calculated to determine and compare inequalities between the 30 EEA countries, by sex, and across time. Annual rate of change was used to determine the differences in DALY rate between 1990 and 2019 for males and females. The Gini Coefficient (GC) was used to measure the DALY rate inequalities across countries, and the Slope Index of Inequality (SII) to estimate the average absolute difference in DALY rate across countries.
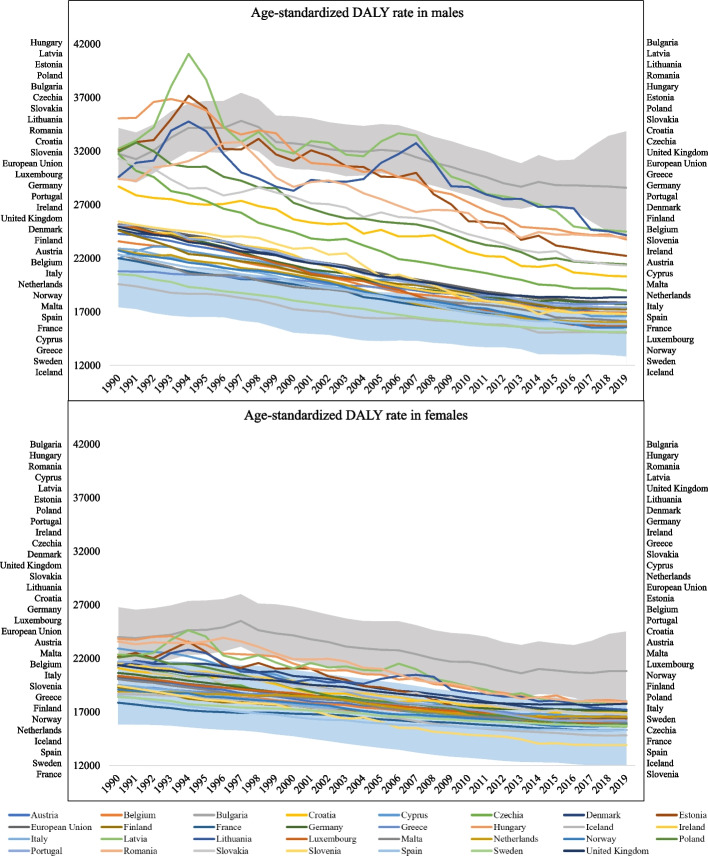
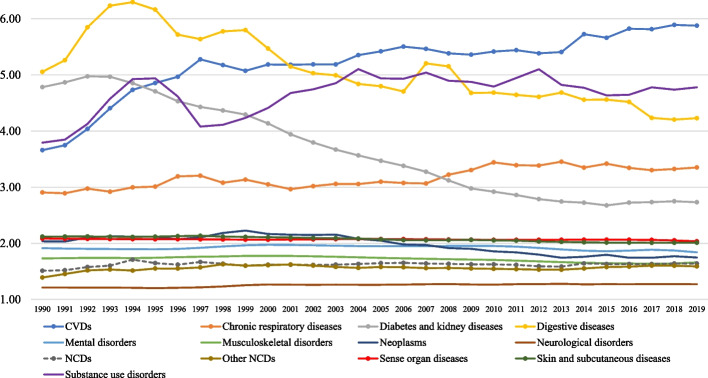
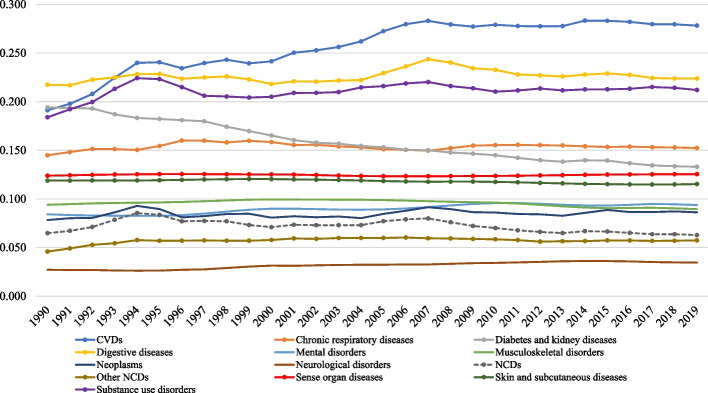
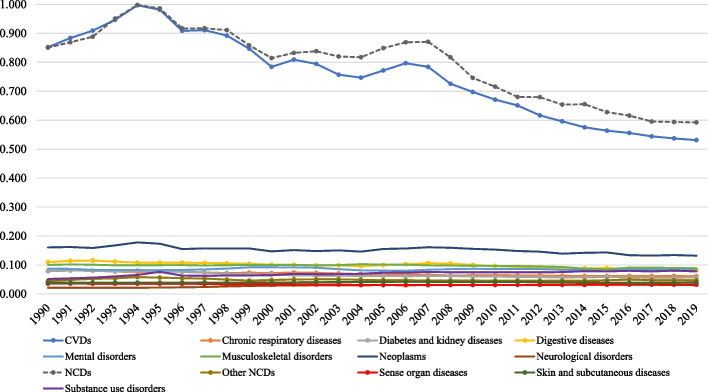
Results: Between 1990 and 2019, there was an overall declining trend in DALY rate, with larger declines among females compared to males. Among EEA countries, in 2019 the highest NCD DALY rate for both sexes were observed for Bulgaria. For the whole period, the highest DALY rate ratios were identified for digestive diseases, diabetes and kidney diseases, substance use disorders, cardiovascular diseases (CVD), and chronic respiratory diseases - representing the highest inequality between countries. In 2019, the highest DALY rate ratio was found between Bulgaria and Iceland for males. GC and SII indicated that the highest inequalities were due to CVD for most of the study period - however, overall levels of inequality were low.
Conclusions: The inequality in level 1 NCDs DALYs rate is relatively low among all the countries. CVDs, digestive diseases, diabetes and kidney diseases, substance use disorders, and chronic respiratory diseases are the NCDs that exhibit higher levels of inequality across countries in the EEA. This might be mitigated by applying tailored preventive measures and enabling healthcare access.
Keywords: DALY rate; European Economic Area; European Union; Global Burden of Disease; Health inequality; Non-communicable diseases.
© 2023. The Author(s).
Conflict of interest statement
The authors declare no competing interests.
Figures

References
-
- Global Burden of Disease Collaborative Network, Global Burden of Disease Study 2019 (GBD 2019) Results (Institute for Health Metrics and Evaluation – IHME) https://vizhub.healthdata.org/gbd-results/.
-
- NCD Data Portal - World Health Organization. https://ncdportal.org/Indicators.
-
- Di Cesare M. Global trends of chronic non-communicable diseases risk factors. Eur J Public Health. 2019;29:ckz185–196. doi: 10.1093/eurpub/ckz185.196. - DOI
Publication types
MeSH terms
LinkOut - more resources
Full Text Sources
Miscellaneous
