. 2023 Jul 6;12(7):1393.
doi: 10.3390/antiox12071393.

When Cannabis sativa L. Turns Purple: Biosynthesis and Accumulation of Anthocyanins

Affiliations

When Cannabis sativa L. Turns Purple: Biosynthesis and Accumulation of Anthocyanins

Laura Bassolino et al. Antioxidants (Basel). .

Abstract

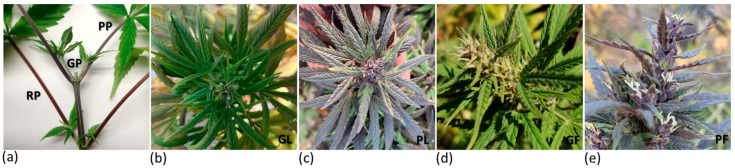
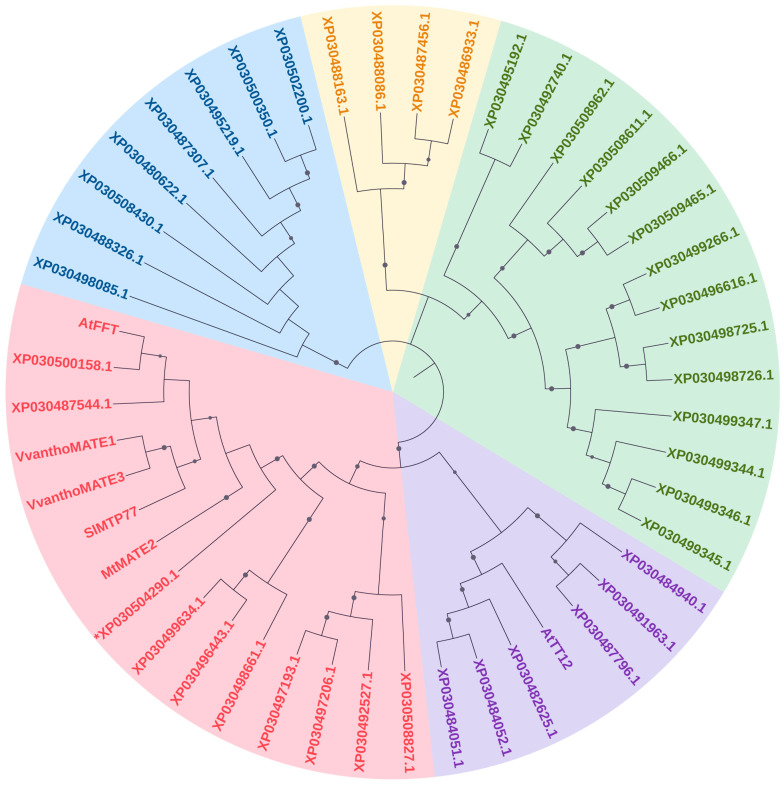
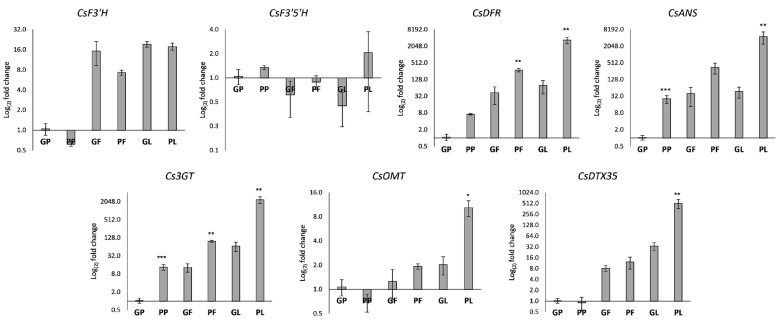
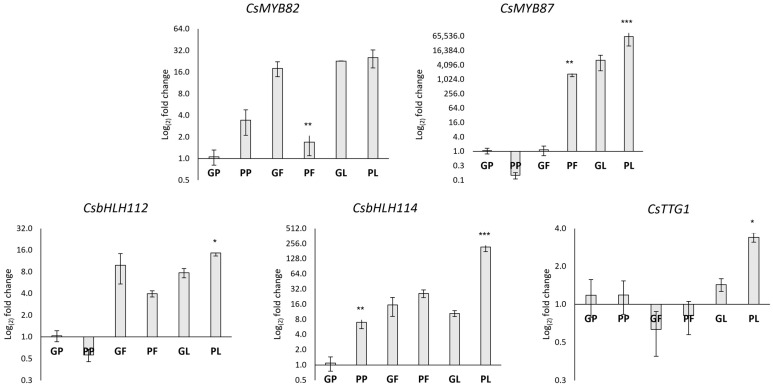
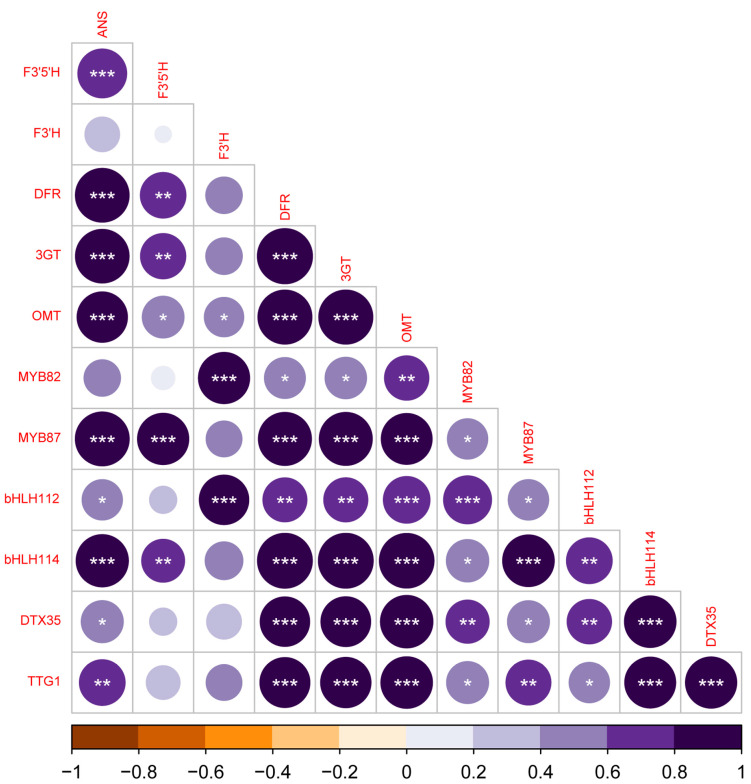
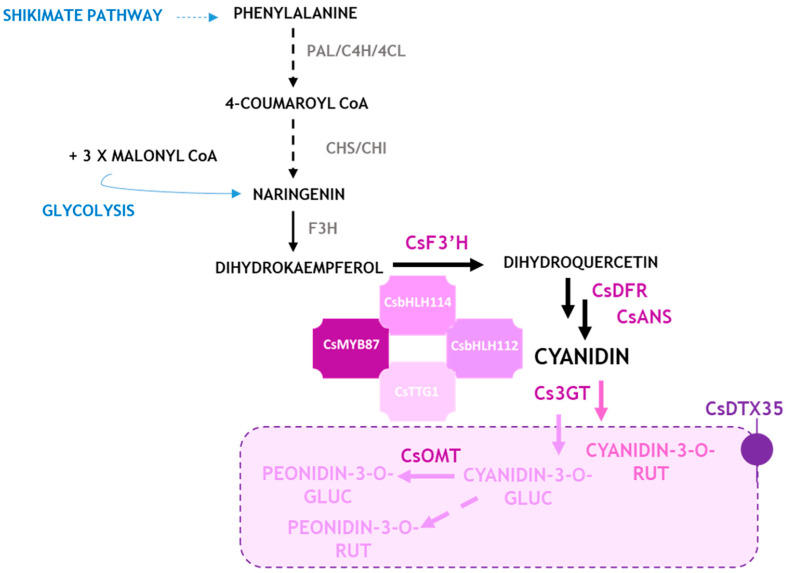
Environmental cues elicit anthocyanin synthesis in plant vegetative and reproductive tissues. Their accumulation in different organs accounts for their diverse biological functions, mainly related to their antioxidant properties, and it depends on a temporally and spatially regulated mechanism controlled by the action of a well-known multi-transcription factor complex. Despite the highly recognizable value of Cannabis sativa L. as a natural biorefinery of phytochemicals, very little information is known on anthocyanin pigmentation in this species. In this work, a targeted quantification of anthocyanins via HPLC-MS/MS, combined with the transcriptional profile via RT-qPCR of genes encoding for structural and decorating enzymes and regulatory transcription factors in different C. sativa tissues, help gain insights into the anthocyanin pathway in this species. To the best of our knowledge, this is the first report on the identification of cyanidin-3-rutinoside (keracyanin) as the major anthocyanin in C. sativa vegetative and floral tissues. Keracyanin amounts were higher than in small berries, suggesting that Cannabis biomass is a valuable source of colored antioxidants to be exploited in diverse applications. Furthermore, a gene putatively encoding for an anthocyanin DTX35 type transporter and CsTTG1 were identified in silico and their transcriptional levels were assessed via RT-qPCR. The results allow us to provide the first model of anthocyanin regulation in C. sativa, opening a new research scenario in this species for both breeding purposes and phytochemical exploitation.

Keywords: Cannabis sativa; HPLC-MS/MS; MATE; MYB; circular economy; decorating enzymes; keracyanin; transcription factors.


Conflict of interest statement

The authors declare no conflict of interest; The funders had no role in the design of the study; in the collection, analyses, or interpretation of data; in the writing of the manuscript; or in the decision to publish the results.

Figures

Figure 1
Figure 1
Representative photos of C. sativa samples used for molecular and biochemical analyses with various intensities of pigmentation. Green (GP), purple (PP) and red petioles (RP) (a) from Fibrante; green leaves (GL) (b), purple leaves (PL) (c), green female flower (GF) (d), and purple female flower (PF) (e) from accession S1750.
Figure 2
Figure 2
Genome wide phylogenetic tree of the putative C. sativa MATE proteins. Different colors indicate major phylogenetic subgroups. Red and purple subgroups belong to the group/type II of MATE transporters according to [42] while the others are C. sativa MATE transporters. Previously described flavonoid transporters belonging to MATEs were included: Arabidopsis thaliana FFT (AT4G25640.2) and AtTT12 (AT3G59030.1); Vitis vinifera VvanthoMATE1, (NP_001290007.1) and VvanthoMATE3 (NP_001268037.1); Medicago truncatula MtMATE2, (XP_003592215.2); Solanum lycopersicum MTP77 (Solyc03g025220.2.1). The evolutionary history was inferred using the Neighbor-Joining method [16]. The optimal tree is shown. The evolutionary distances were computed using the p-distance method and are in the units of the number of amino acid differences per site. This analysis involved 48 amino acid sequences. All ambiguous positions were removed for each sequence pair (pairwise deletion option). There were a total of 742 positions in the final dataset. Evolutionary analyses were conducted in MEGA11 [15]. The asterisk indicates the CsDTX35 (XP030504290.1) transporter. All amino acid sequences are reported in Supplementary Table S2. Bootstrap support values ≥ of 30% were indicated by grey circle on the tree branches.
Figure 3
Figure 3
Relative expression levels of genes encoding late enzymes in different tissues of C. sativa by RT-qPCR. Transcription levels were calculated with the ΔΔCt method according to Pfaffl et al., 2005 using the Green Petiole (GP) as calibrator. The data are reported on a Log2 scale as the mean ± standard error of the mean (n = 3). Asterisks indicate Student’s t-test statistically significant differences: * p < 0.05; ** p < 0.01; *** p < 0.001. GP: Green petiole; PP: Purple petiole; GF: Green flower; PF: Purple flower; GL: Green leaf: PL: Purple leaf. GP and PP were from Fibrante; GF, PF, GL, and PL from s1750 accession. The whole name of analyzed Cannabis genes is detailed in the abbreviation list.
Figure 4
Figure 4
Relative gene expression levels of transcription factors in different tissues of C. sativa by RT-qPCR. Transcription levels were calculated with the ΔΔCt method according to Pfaffl et al. 2005 using the Green Petiole (GP) as calibrator. The data are reported on a Log2 scale as the mean ± standard error of the mean (n = 3). Asterisks indicate Student’s t-test statistically significant differences: * p < 0.05; ** p < 0.01; *** p < 0.001. GP: Green petiole; PP: Purple petiole; GF: Green flower; PF: Purple flower; GL: Green leaf: PL: Purple leaf. GP and PP were from Fibrante; GF, PF, GL, and PL from s1750 accession. The name of analyzed Cannabis genes is detailed in abbreviation list.
Figure 5
Figure 5
Correlation plot of Cannabis anthocyanin-related structural and regulatory genes. Correlation analysis using Pearson’s correlation matrix of transcriptional level of structural and regulatory genes involved in the anthocyanin synthesis. Dark purple indicates positive correlation, brown indicates negative correlation. Asterisks denote significant association between samples (*, p < 0.05; **, p <0.01; ***, p < 0.001).
Figure 6
Figure 6
Proposed model for anthocyanin synthesis and regulation in C. sativa. For enzymes, please refer to the abbreviation list. The dotted arrows and enzymes written in grey stand for hypothesized steps and/or not analyzed in this work, respectively.

References

    1. Saigo T., Wang T., Watanabe M., Tohge T. Diversity of anthocyanin and proanthocyanin biosynthesis in land plants. Curr. Opin. Plant Biol. 2020;55:93–99. doi: 10.1016/j.pbi.2020.04.001. - DOI - PubMed
    1. Wong D.C.J., Pichersky E., Peakall R. Many different flowers make a bouquet: Lessons from specialized metabolite diversity in plant-pollinator interactions. Curr. Opin. Plant Biol. 2023;73:102332. doi: 10.1016/j.pbi.2022.102332. - DOI - PubMed
    1. Schaefer H.M., McGraw K., Catoni C. Birds use fruit colour as honest signal of dietary antioxidant rewards. Funct. Ecol. 2008;22:303–310. doi: 10.1111/j.1365-2435.2007.01363.x. - DOI
    1. Kiferle C., Fantini E., Bassolino L., Povero G., Spelt C., Buti S., Giuliano G., Quattrocchio F., Koes R., Perata P., et al. Tomato R2R3-MYB Proteins SlANT1 and SlAN2: Same Protein Activity, Different Roles. PLoS ONE. 2015;10:e0136365. doi: 10.1371/journal.pone.0136365. - DOI - PMC - PubMed
    1. Kaur S., Tiwari V., Kumari A., Chaudhary E., Sharma A., Ali U., Garg M. Protective and defensive role of anthocyanins under plant abiotic and biotic stresses: An emerging application in sustainable agriculture. J. Biotechnol. 2023;361:12–29. doi: 10.1016/j.jbiotec.2022.11.009. - DOI - PubMed

LinkOut - more resources