Benthic Heterotrophic Protist Communities of the Southern Baltic Analyzed with the Help of Curated Metabarcoding Studies
- PMID: 37508439
- PMCID: PMC10376117
- DOI: 10.3390/biology12071010
Benthic Heterotrophic Protist Communities of the Southern Baltic Analyzed with the Help of Curated Metabarcoding Studies
Abstract
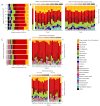
Heterotrophic protists are key components of marine ecosystems. They act as controllers of bacterial and microphytobenthos production and contribute significantly to the carbon flux to higher trophic levels. Still, metabarcoding studies on benthic protist communities are much less frequent than for planktonic organisms. Especially in the Baltic Sea, representing the largest brackish water environment on earth, so far, no extensive metabarcoding studies have been conducted to assess the diversity of benthic protists in this unique and diverse habitat. This study aims to give first insights into the diversity of benthic protist communities in two different regions of the Baltic Sea, Fehmarnbelt, and Oderbank. Using amplicon sequencing of the 18S rDNA V9 region of over 100 individual sediment samples, we were able to show significant differences in the community composition between the two regions and to give insights into the vertical distribution of protists within the sediment (0-20 cm). The results indicate that the differences in community composition in the different regions might be explained by several abiotic factors such as salinity and water depth, but are also influenced by methodological aspects such as differences between DNA and RNA results.
Keywords: Baltic Sea; amplicon sequencing; brackish; diversity; sediment; unicellular eukaryotes.
Conflict of interest statement
The authors declare no conflict of interest.
Figures


Similar articles
-
Distribution Patterns of Benthic Protist Communities Depending on Depth Revealed by Environmental Sequencing-From the Sublittoral to the Deep Sea.Microorganisms. 2023 Jun 26;11(7):1664. doi: 10.3390/microorganisms11071664. Microorganisms. 2023. PMID: 37512837 Free PMC article.
-
Habitat Heterogeneity and Connectivity: Effects on the Planktonic Protist Community Structure at Two Adjacent Coastal Sites (the Lagoon and the Gulf of Venice, Northern Adriatic Sea, Italy) Revealed by Metabarcoding.Front Microbiol. 2019 Nov 26;10:2736. doi: 10.3389/fmicb.2019.02736. eCollection 2019. Front Microbiol. 2019. PMID: 32038505 Free PMC article.
-
Diversity of Pico- to Mesoplankton along the 2000 km Salinity Gradient of the Baltic Sea.Front Microbiol. 2016 May 12;7:679. doi: 10.3389/fmicb.2016.00679. eCollection 2016. Front Microbiol. 2016. PMID: 27242706 Free PMC article.
-
Gazing into the abyss: A glimpse into the diversity, distribution, and behaviour of heterotrophic protists from the deep-sea floor.Environ Microbiol. 2024 Mar;26(3):e16598. doi: 10.1111/1462-2920.16598. Environ Microbiol. 2024. PMID: 38444221 Review.
-
Protist metabarcoding and environmental biomonitoring: Time for change.Eur J Protistol. 2016 Aug;55(Pt A):12-25. doi: 10.1016/j.ejop.2016.02.003. Epub 2016 Feb 22. Eur J Protistol. 2016. PMID: 27004417 Review.
Cited by
-
Protist communities of microbial mats from the extreme environments of five saline Andean lagoons at high altitudes in the Atacama Desert.Front Microbiol. 2024 Mar 20;15:1356977. doi: 10.3389/fmicb.2024.1356977. eCollection 2024. Front Microbiol. 2024. PMID: 38572231 Free PMC article.
-
The dilemma of underestimating freshwater biodiversity: morphological and molecular approaches.BMC Ecol Evol. 2024 May 27;24(1):69. doi: 10.1186/s12862-024-02261-y. BMC Ecol Evol. 2024. PMID: 38802764 Free PMC article.
-
Together throughout the year: seasonal patterns of bacterial and eukaryotic microbial communities in a macrotidal estuary.Environ Microbiome. 2025 Jan 20;20(1):8. doi: 10.1186/s40793-025-00664-y. Environ Microbiome. 2025. PMID: 39833892 Free PMC article.
-
Biodiversity of microorganisms in the Baltic Sea: the power of novel methods in the identification of marine microbes.FEMS Microbiol Rev. 2024 Sep 18;48(5):fuae024. doi: 10.1093/femsre/fuae024. FEMS Microbiol Rev. 2024. PMID: 39366767 Free PMC article. Review.
-
Beyond the Surface: The Peculiar World of Benthic Biodiversity, from Microbes to Multicellular Life and Their Ecosystem Roles.Biology (Basel). 2025 Apr 3;14(4):368. doi: 10.3390/biology14040368. Biology (Basel). 2025. PMID: 40282233 Free PMC article.
References
-
- Marcus N.H., Boero F. Minireview The Importance of Benthic-Pelagic Coupling and the Forgotten Role of Life Cycles in Coastal Aquatic Systems. Limnol. Oceanogr. 1998;43:763–768. doi: 10.4319/lo.1998.43.5.0763. - DOI
-
- Rodríguez-Martínez R., Leonard G., Milner D.S., Sudek S., Conway M., Moore K., Hudson T., Mahé F., Keeling P.J., Santoro A.E., et al. Controlled Sampling of Ribosomally Active Protistan Diversity in Sediment-Surface Layers Identifies Putative Players in the Marine Carbon Sink. ISME J. 2020;14:984–998. doi: 10.1038/s41396-019-0581-y. - DOI - PMC - PubMed
-
- Arndt H., Dietrich D., Auer B., Cleven E.-J., Gräfenhan T., Weitere M., Mynikov A. Functional Diversity of Heterotrophic Flagellates in Aquatic Ecosystems. In: Leadbeater B.S.C., Green J.C., editors. The Flagellates. Taylor & Francis Ltd.; London, UK: 2000. pp. 240–268.
Grants and funding
LinkOut - more resources
Full Text Sources

