. 2023 Jul 13;12(14):1844.
doi: 10.3390/cells12141844.

S1P Lyase Deficiency in the Brain Promotes Astrogliosis and NLRP3 Inflammasome Activation via Purinergic Signaling

Affiliations

S1P Lyase Deficiency in the Brain Promotes Astrogliosis and NLRP3 Inflammasome Activation via Purinergic Signaling

Shah Alam et al. Cells. .

Abstract

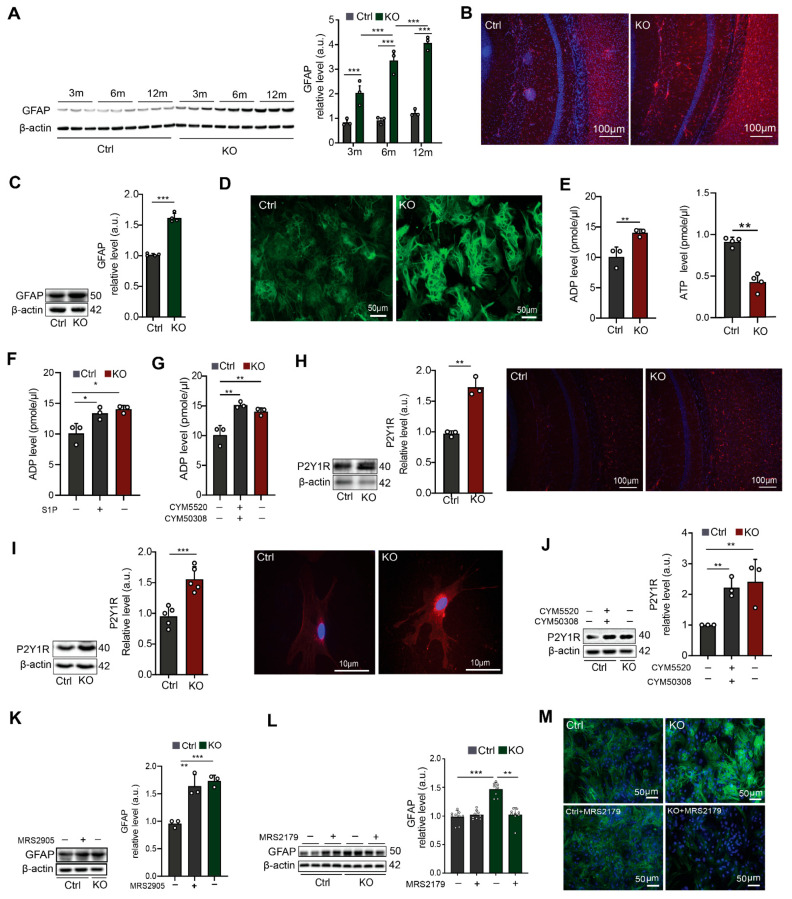
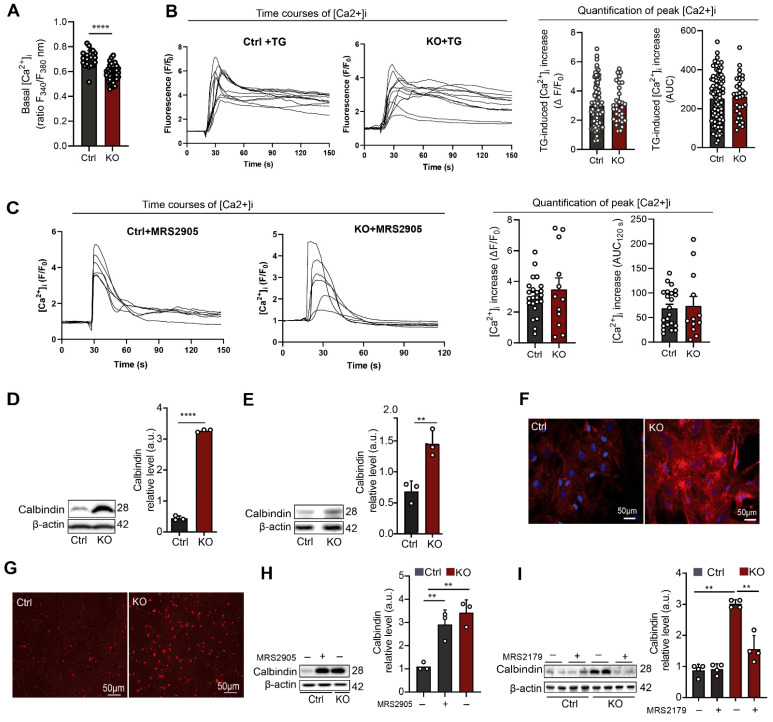
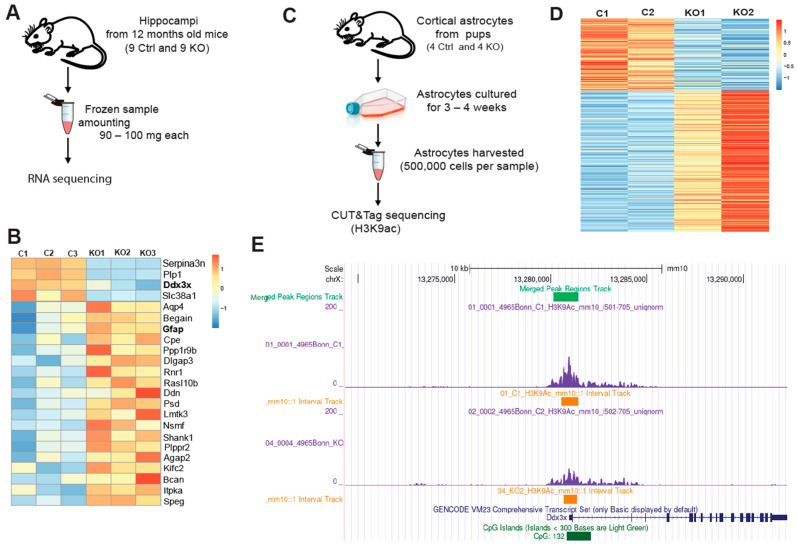
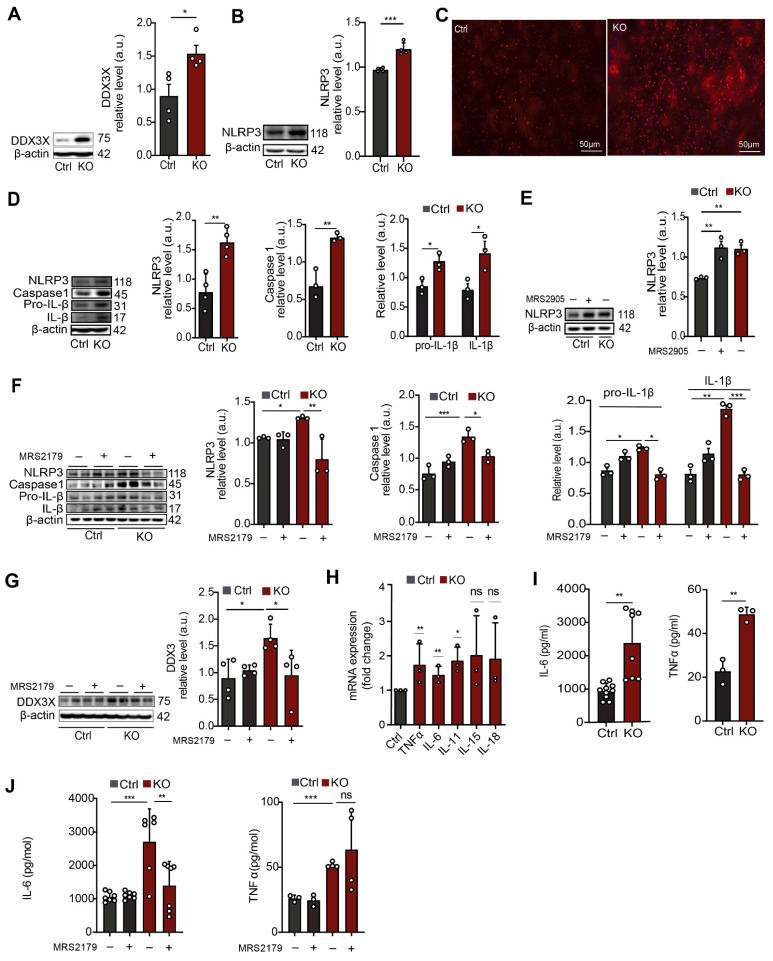
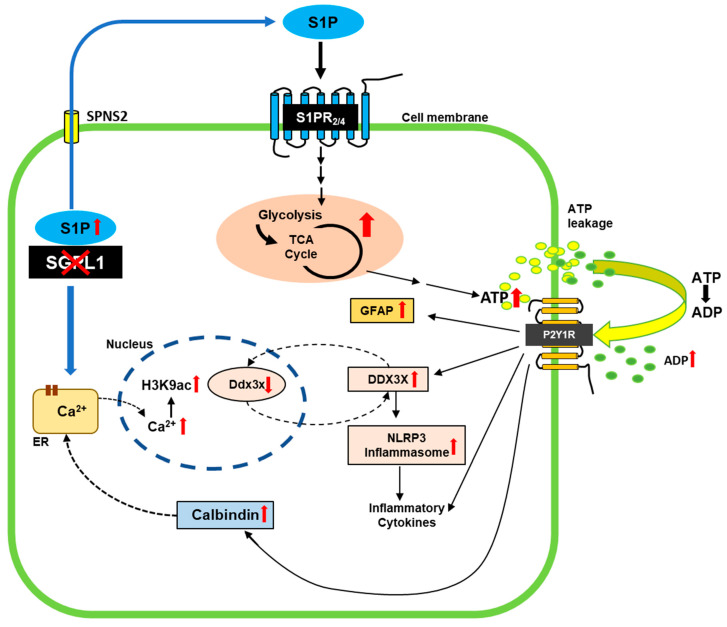
Astrocytes are critical players in brain health and disease. Brain pathologies and lesions are usually accompanied by astroglial alterations known as reactive astrogliosis. Sphingosine 1-phosphate lyase (SGPL1) catalysis, the final step in sphingolipid catabolism, irreversibly cleaves its substrate sphingosine 1-phosphate (S1P). We have shown that neural ablation of SGPL1 causes accumulation of S1P and hence neuronal damage, cognitive deficits, as well as microglial activation. Moreover, the S1P/S1P-receptor signaling axis enhances ATP production in SGPL1-deficient astrocytes. Using immunohistochemical methods as well as RNA Seq and CUT&Tag we show how S1P signaling causes activation of the astrocytic purinoreceptor P2Y1 (P2Y1R). With specific pharmacological agonists and antagonists, we uncover the P2Y1R as the key player in S1P-induced astrogliosis, and DDX3X mediated the activation of the NLRP3 inflammasome, including caspase-1 and henceforward generation of interleukin-1ß (IL-1ß) and of other proinflammatory cytokines. Our results provide a novel route connecting S1P metabolism and signaling with astrogliosis and the activation of the NLRP3 inflammasome, a central player in neuroinflammation, known to be crucial for the pathogenesis of numerous brain illnesses. Thus, our study opens the door for new therapeutic strategies surrounding S1P metabolism and signaling in the brain.

Keywords: DDX3X; NLRP3 inflammasome; P2Y1 receptor (P2Y1R); S1P-lyase (SGPL1); astrogliosis; calbindin; calcium; neuroinflammation; sphingosine 1-phosphate (S1P).


Conflict of interest statement

The authors declare no conflict of interest.

Figures

Figure 1
Figure 1
Neural ablation of SGPL1 triggers astrogliosis in murine brains via P2Y1 receptors. (A) Protein quantification of GFAP in cortices of control (Ctrl) and SGPL1-deficient (KO) mice of the indicated age in months (m). (B,D) Representative images of cortical slices and cultured astrocytes stained for GFAP from Ctrl and KO mice. (C) Protein quantification of GFAP in primary cultured astrocytes from Ctrl and KO mice. (E) Quantification of ADP and ATP in the culture media of astrocytes derived from Ctrl and KO mice. (F,G) Quantification of ADP level in the presence (+) and absence (−) of S1P (10 nM, 24 h) and of S1PR2/4 agonist (CYM5520 and CYM50308, 5 µM each) as indicated in the culture media of astrocytes derived from Ctrl and KO mice. (H,I) Protein quantification of P2Y1 receptor (P2Y1R) and representative images from cortical slices and cultured single astrocytes stained for P2Y1R from Ctrl and KO mice. (J) Protein quantification of P2Y1R in primary cultured astrocytes in the presence (+) and absence (−) of S1PR2/4 agonist (CYM5520 and CYM50308, 5 µM each) for 24 h as indicated. (K) Protein quantification of GFAP in primary cultured astrocytes in the presence (+) and absence (−) of P2Y1 agonist, (MRS2905, 5 nM) from Ctrl and KO mice. (L) Protein quantification of GFAP in the presence (+) and absence (−) of P2Y1 antagonist (MRS2179, 100 µM), as indicated from Ctrl and KO astrocytes. (M) Representative images of primary cultured astrocytes stained for GFAP from Ctrl and KO mice in presence (+) and absence (−) of P2Y1R antagonist (MRS2179, 100 µM). For all, representative immunoblots are shown with β-actin as loading control. Bars represent means ± SEM, (n ≥ 3; one way ANOVA and unpaired Student t test; * p < 0.05 ** p < 0.001, *** p < 0.0001).
Figure 2
Figure 2
P2Y1R activation modulates calbindin expression in SGPL1-deficient astrocytes. (A) Basal [Ca2+]i was measured in cells loaded with fura-2. Shown is the ratio of fluorescence emission at 340 and 380 nm of excitation. Each dot represents a single cell (Ctrl, control; KO, SGPL1-deficient). (B) Thapsigargin-induced [Ca2+]i increases were measured in fluo-4-loaded cells stimulated with 1 μM thapsigargin (TG). Left: Representative time courses of [Ca2+]i in individual Ctrl and KO cells. Fluo-4 fluorescence was normalized to baseline values (F/F0). Right: Quantification of peak [Ca2+]i increases (ΔF/F0) and areas under the curve (AUCs; measured for 120 s after addition of thapsigargin). Each dot represents a single cell. (C) P2Y1R agonist-induced [Ca2+]i increases were measured in fluo-4-loaded cells stimulated with 5 nM MRS2905. Left: Representative time courses of [Ca2+]i in individual Ctrl and KO cells. Fluo-4 fluorescence was normalized to baseline values (F/F0). Right: Quantification of [Ca2+]i induced by the P2Y1R agonist. Shown are peak [Ca2+]i increases (ΔF/F0) and areas under the curve (AUCs; measured for 120 s after addition of agonist). Each dot represents a single cell. (D,E) Protein quantification of calbindin in primary cultured astrocytes and cortices of Ctrl and KO mice. (F,G) Representative images of astrocytes and cortical slices stained for calbindin from Ctrl and KO mice. (H) Protein quantification of calbindin in primary cultured astrocytes for 24 h in the presence (+) and absence (−) of P2Y1 agonist (MRS2905, 5µM) as indicated. (I) Protein quantification of calbindin in primary cultured astrocytes treated for 24 h in the presence (+) and absence (−) of P2Y1R antagonist (MRS2179, 100 µM) as indicated. For all, representative immunoblots are shown with β-actin as loading control. Bars represent means ± SEM, (n ≥ 3; one way ANOVA and unpaired Student t test; ** p < 0.001, **** p < 0.00001).
Figure 3
Figure 3
Transcriptome analysis in hippocampi and CUT&Tag chromatin profiling for histone H3K9ac in astrocytes. (A) Overview of RNA-Sequencing. (B) Heat map of differentially transcribed genes (see also Supplementary File S1). (C) Summary of CUT&Tag sequencing. (D) Heat map showing the intensity of H3K9ac signals across the astrocytic genome. Each sample shown contains astrocytes pooled from two individuals. (E) Visualization of a 10 kb chromatin segment of the Ddx3x promoter region showing the H3K9ac occupancy, using Integrated Genome Browser (see also Supplementary File S2).
Figure 4
Figure 4
Neural SGPL1 ablation activates inflammation via P2Y1R in primary cultured astrocytes. (A,B) Protein quantification of DDX3X and NLPR3 in cortices of control (Ctrl) and SGPL1-deficient (KO) mice. (C) Representative images of cortical slices stained for NLPR3 from Ctrl and KO mice. (D) Protein quantification of NLRP3, Caspase1, Pro-IL-β, and IL-β in primary cultured astrocytes of Ctrl and KO mice. (E) Protein quantification of NLRP3 in primary cultured astrocytes for 24 h in the presence (+) and absence (−) of P2Y1R agonist (MRS2905, 5 nM) as indicated. (F,G) Protein quantification of NLRP3, Caspase1, Pre-IL-β and IL-β, and DDX3X in the primary cultured astrocytes treated for 24 h in the presence (+) and absence (−) of P2Y1R antagonist (MRS2179, 100 µM) as indicated. (H) Relative mRNA transcripts of the indicated cytokines in SGPL1-deficient astrocytes assessed by qPCR. (I,J) Expression of IL-6 and TNFα in Ctrl and KO astrocytes with (+) and without (−) P2Y1 antagonist (MRS2179, 100 µM) treatment. For all, representative immunoblots are shown with β-actin as loading control. Bars represent means ± SEM, (n ≥ 3; one way ANOVA and unpaired Student t test; * p < 0.01, ** p < 0.001, *** p < 0.0001).
Figure 5
Figure 5
Scheme of the effects of SGPL1 ablation in astrocytes. In the absence of SGPL1, accumulated S1P is secreted by the cells [23]. By binding to S1PR2,4, it elicits signaling cascades that promote increased expression of proteins involved in glucose breakdown via glycolysis and the TCA [24], finally leading to an increased amount of extracellular ADP, a ligand of P2Y1R. Shown are the implications of this receptor in the gliotic and hence proinflammatory response of SGPL1-deficient astrocytes. In addition, P2Y1R signaling triggers the expression of calbindin, which binds cytosolic Ca2+ released from the endoplasmic reticulum as a result of S1P accumulation [67]. Finally, nuclear Ca2+ promotes H3K9 acetylation [22] that affects the transcription of Ddx3x. The increased expression of DDX3X suggests a possible feedback loop between protein level and transcriptional regulation. See text for further explanations.

References

    1. Spiegel S., Milstien S. Sphingosine-1-phosphate: An enigmatic signalling lipid. Nat. Rev. Mol. Cell Biol. 2003;4:397–407. doi: 10.1038/nrm1103. - DOI - PubMed
    1. Karunakaran I., van Echten-Deckert G. Sphingosine 1-phosphate—A double edged sword in the brain. Biochim. Biophys. Acta. 2017;1859:1573–1582. doi: 10.1016/j.bbamem.2017.03.008. - DOI - PubMed
    1. Grassi S., Mauri L., Prioni S., Cabitta L., Sonnino S., Prinetti A., Giussani P. Sphingosine 1-Phosphate Receptors and Metabolic Enzymes as Druggable Targets for Brain Diseases. Front. Pharmacol. 2019;10:807. doi: 10.3389/fphar.2019.00807. - DOI - PMC - PubMed
    1. Edsall L.C., Spiegel S. Enzymatic measurement of sphingosine 1-phosphate. Anal. Biochem. 1999;272:80–86. doi: 10.1006/abio.1999.4157. - DOI - PubMed
    1. Futerman A.H. Biochemistry of Lipids and Membranes. 6th ed. Elsevier; Amsterdam, The Netherlands: 2016. Sphingolipids; pp. 297–326.

Publication types

LinkOut - more resources