. 2023 Jul 17;12(14):1868.
doi: 10.3390/cells12141868.

Disruption of the Mammalian Ccr4-Not Complex Contributes to Transcription-Mediated Genome Instability

Affiliations

Disruption of the Mammalian Ccr4-Not Complex Contributes to Transcription-Mediated Genome Instability

Nafiseh Chalabi Hagkarim et al. Cells. .

Abstract

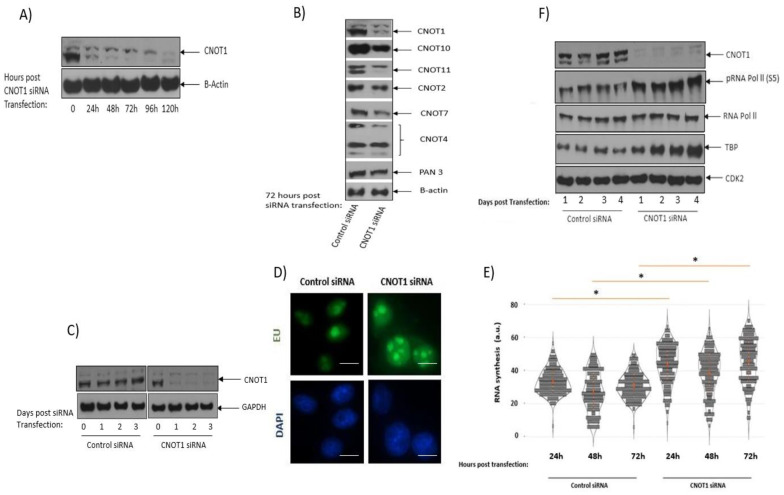
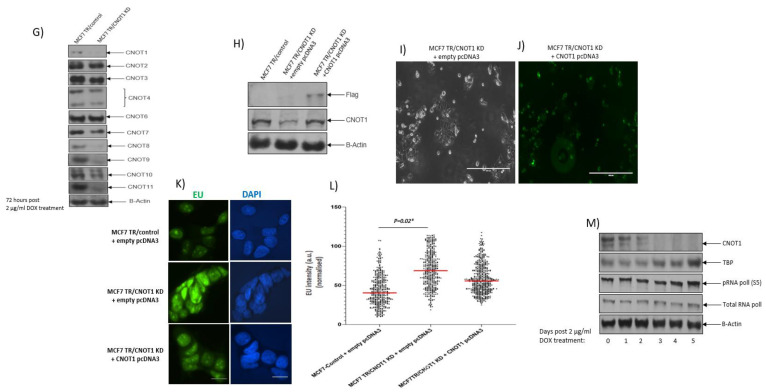
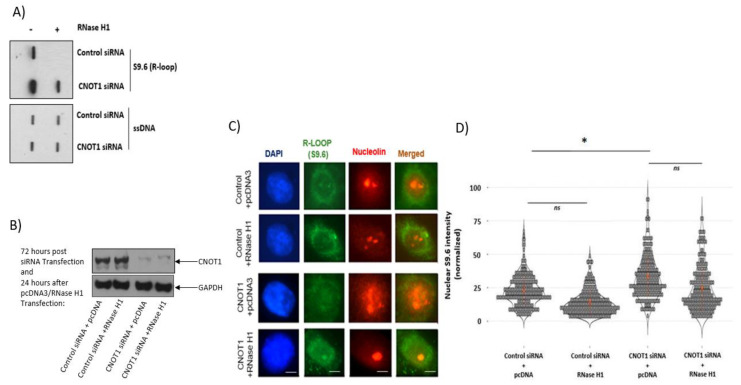
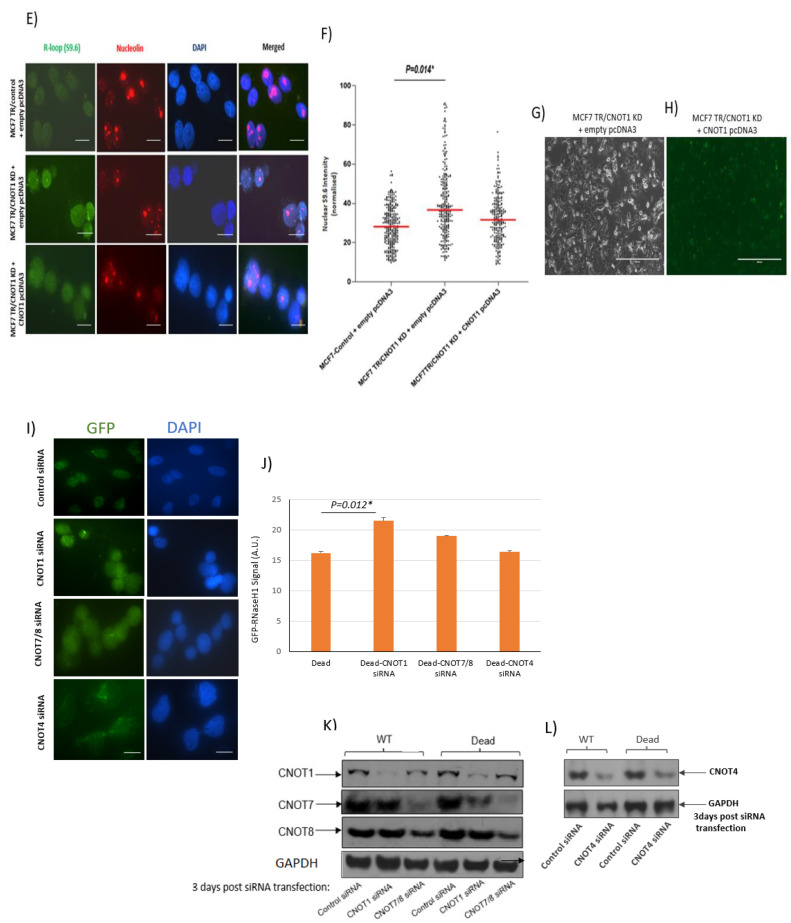
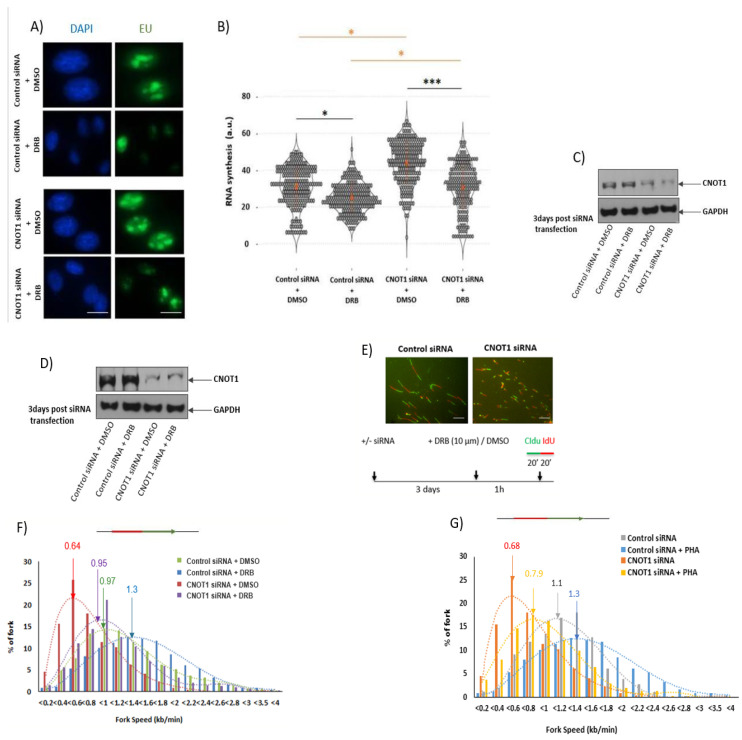
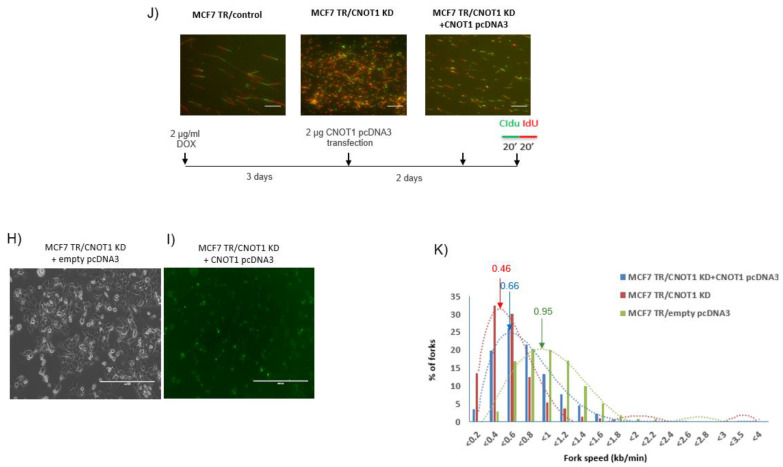
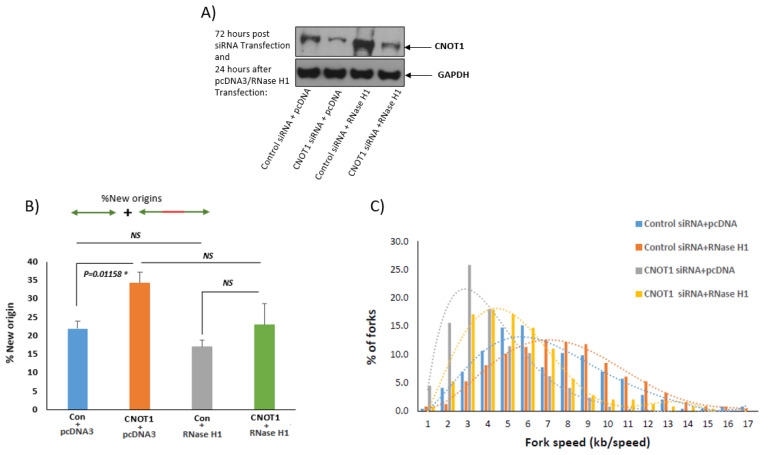
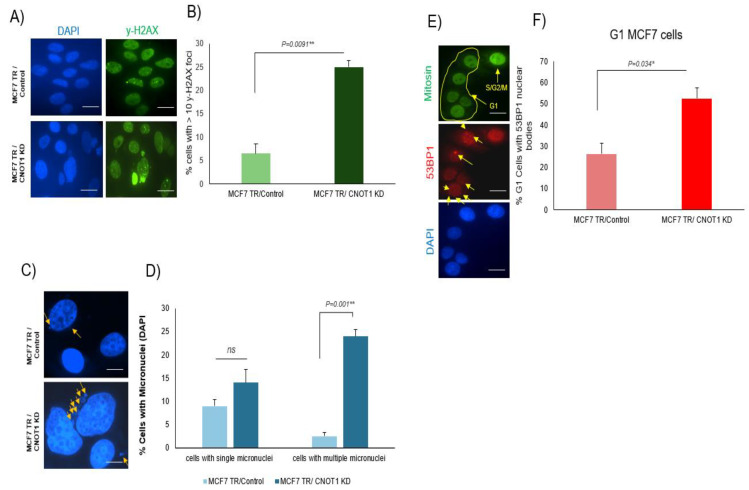
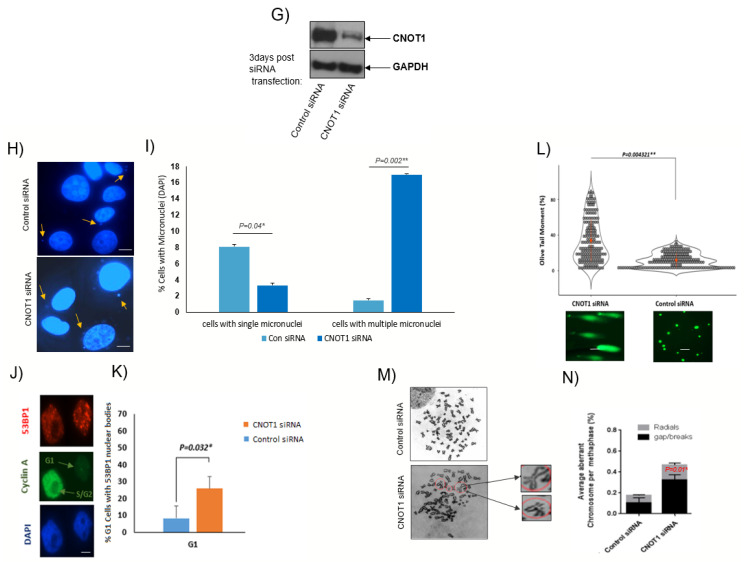
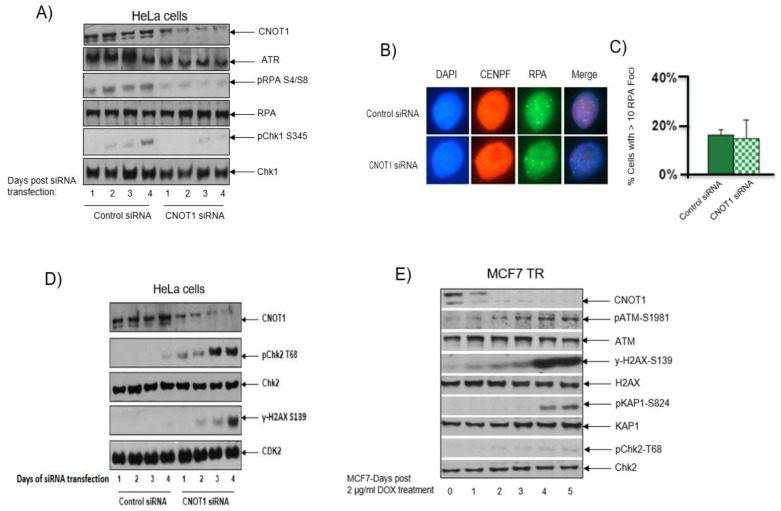
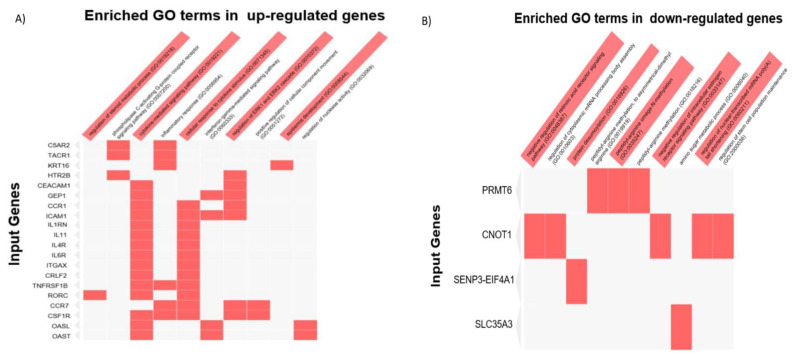
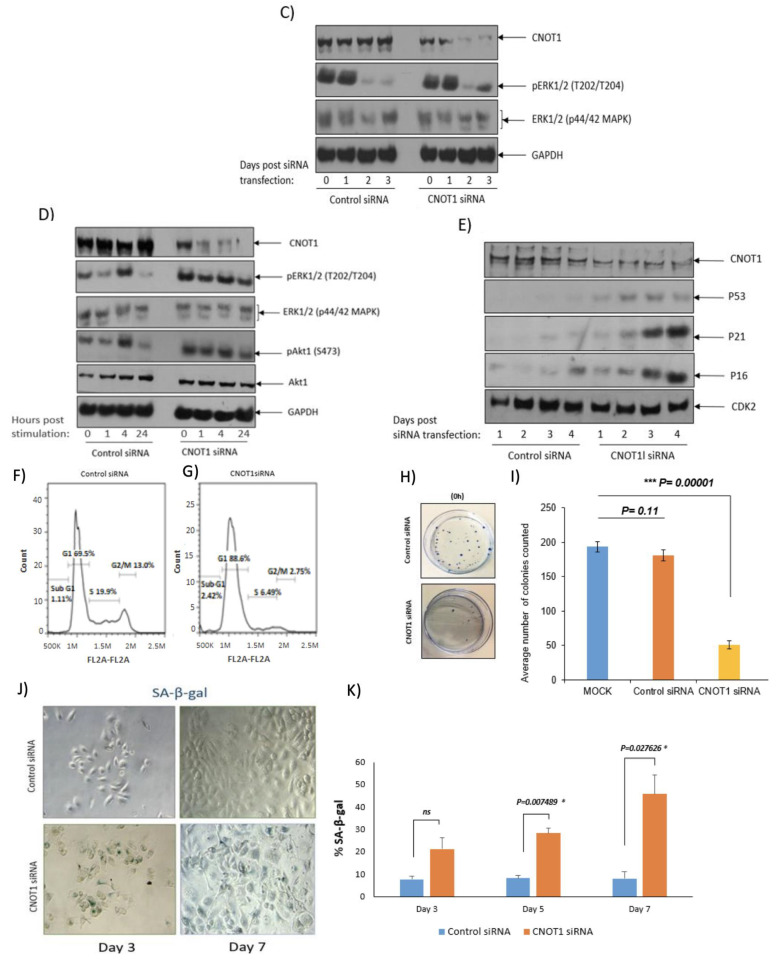
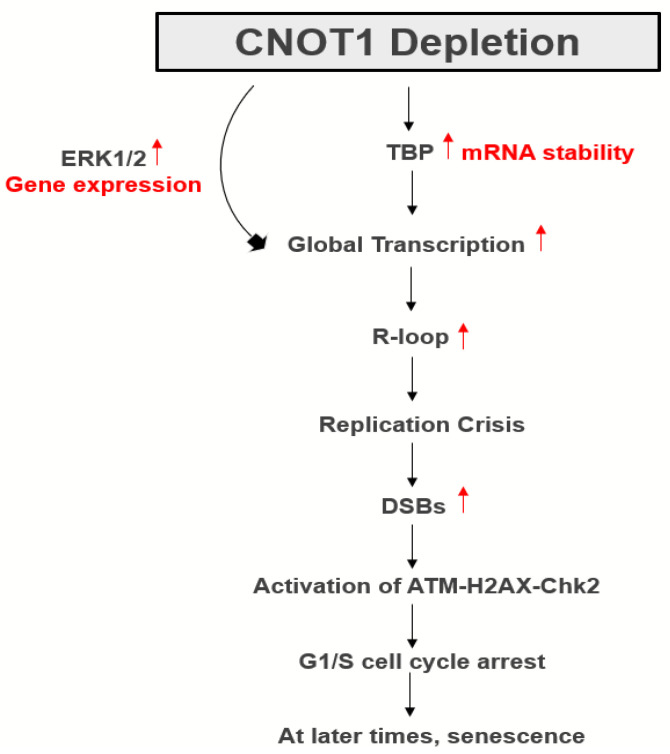
The mammalian Ccr4-Not complex, carbon catabolite repression 4 (Ccr4)-negative on TATA-less (Not), is a large, highly conserved, multifunctional assembly of proteins that acts at different cellular levels to regulate gene expression. It is involved in the control of the cell cycle, chromatin modification, activation and inhibition of transcription initiation, control of transcription elongation, RNA export, and nuclear RNA surveillance; the Ccr4-Not complex also plays a central role in the regulation of mRNA decay. Growing evidence suggests that gene transcription has a vital role in shaping the landscape of genome replication and is also a potent source of replication stress and genome instability. Here, we have examined the effects of the inactivation of the Ccr4-Not complex, via the depletion of the scaffold subunit CNOT1, on DNA replication and genome integrity in mammalian cells. In CNOT1-depleted cells, the elevated expression of the general transcription factor TATA-box binding protein (TBP) leads to increased RNA synthesis, which, together with R-loop accumulation, results in replication fork slowing, DNA damage, and senescence. Furthermore, we have shown that the stability of TBP mRNA increases in the absence of CNOT1, which may explain its elevated protein expression in CNOT1-depleted cells. Finally, we have shown the activation of mitogen-activated protein kinase signalling as evidenced by ERK1/2 phosphorylation in the absence of CNOT1, which may be responsible for the observed cell cycle arrest at the border of G1/S.

Keywords: CNOT complex; CNOT1; CNOT7; CNOT8; DNA repair; genome instability; transcription.


Conflict of interest statement

The authors have no conflict of interest.

Figures

Figure 1
Figure 1
CNOT1 depletion increases global transcription in HeLa and MCF7 cells. (A) Representative immunoblot shows CNOT1 depletion at different time points (0, 24 h, 48 h, 72 h, 96 h and 120 h) after transfection of HeLa cells with CNOT1 siRNA. (B) siRNA-transfected HeLa cells were lysed, and the lysates assessed by immunoblotting with the indicated antibodies against different CNOT subunits and Pan 3. (C) Representative immunoblot confirms depletion of CNOT1 via siRNA up to 72 h. (D) Representative IF images show the labelling of global nascent RNA using 5-ethynyluridine (EU) incorporation assay in control and CNOT1-depleted HeLa cells. The global transcription activity was measured after EU incorporation (1 h) shown after 24, 48, and 72 h in (E). To quantify EU incorporation, Hoechst was used to stain the nucleus of cells, generating a nuclear mask. Adobe Photoshop was used to adjust the levels of all panels equally. Quantification of EU signal per nucleus was performed using RStudio statistical software and the results shown (n = 3 independent experiments, 100 cells counted. Stats: Mann–Whitney Wilcoxon Rank Sum). (F) Representative Western blot showing the expression level of TBP and the phosphorylation of RNA Polymerase II C-terminal domain (S5) in each experimental condition. CDK2 was used as a loading control. (G) Representative Western blot showing the expression level of CNOT subunits in the presence or absence of CNOT1 in MCF7 TR/ Control and CNOT1 KD cells. (H) Representative Western blot confirms the CNOT1 (flag-tagged) pcDNA3 transfection in MCF7 TR/CNOT1 KD cells (Transfection efficiency was generally in the range 20–25%). (I,J) Representative images show transfection efficiency (22%). Images were collected using an EVOS fluorescence inverted digital microscope. MCF7 cells were fixed, permeabilized, and labelled with anti-FLAG antibody (green). Percentage transfection efficiency: (Fluorescent cells/Total number of cells) × 100. Bar 400 µm. (K,L) Transcription elongation was measured after EU incorporation (1 h) 3-day post +/− 2 μg/mL DOX treatment in MCF-7 TR control and MCF7 TR CNOT1KD cells (Representative cells are shown in (H)). To quantify EU incorporation, Hoechst was used to stain the nucleus of cells, generating a nuclear mask. Adobe Photoshop was used to adjust the levels of all panels equally. Quantification of EU signal per nucleus was performed using GraphPad Prism statistical software; (n = 3 independent experiments; >100 cells analysed per repeat; Stats: unpaired t-test, * p < 0.05). (M) Representative Western blot showing the expression level of TBP and the phosphorylation of RNA Polymerase II C-terminal domain (S5) in MCF-7 TR CNOT1KD cells up to 5 days post 2 μg/mL DOX induction. Scale bar in (C,H) = 50 µm. a.u, arbitrary units.
Figure 1
Figure 1
CNOT1 depletion increases global transcription in HeLa and MCF7 cells. (A) Representative immunoblot shows CNOT1 depletion at different time points (0, 24 h, 48 h, 72 h, 96 h and 120 h) after transfection of HeLa cells with CNOT1 siRNA. (B) siRNA-transfected HeLa cells were lysed, and the lysates assessed by immunoblotting with the indicated antibodies against different CNOT subunits and Pan 3. (C) Representative immunoblot confirms depletion of CNOT1 via siRNA up to 72 h. (D) Representative IF images show the labelling of global nascent RNA using 5-ethynyluridine (EU) incorporation assay in control and CNOT1-depleted HeLa cells. The global transcription activity was measured after EU incorporation (1 h) shown after 24, 48, and 72 h in (E). To quantify EU incorporation, Hoechst was used to stain the nucleus of cells, generating a nuclear mask. Adobe Photoshop was used to adjust the levels of all panels equally. Quantification of EU signal per nucleus was performed using RStudio statistical software and the results shown (n = 3 independent experiments, 100 cells counted. Stats: Mann–Whitney Wilcoxon Rank Sum). (F) Representative Western blot showing the expression level of TBP and the phosphorylation of RNA Polymerase II C-terminal domain (S5) in each experimental condition. CDK2 was used as a loading control. (G) Representative Western blot showing the expression level of CNOT subunits in the presence or absence of CNOT1 in MCF7 TR/ Control and CNOT1 KD cells. (H) Representative Western blot confirms the CNOT1 (flag-tagged) pcDNA3 transfection in MCF7 TR/CNOT1 KD cells (Transfection efficiency was generally in the range 20–25%). (I,J) Representative images show transfection efficiency (22%). Images were collected using an EVOS fluorescence inverted digital microscope. MCF7 cells were fixed, permeabilized, and labelled with anti-FLAG antibody (green). Percentage transfection efficiency: (Fluorescent cells/Total number of cells) × 100. Bar 400 µm. (K,L) Transcription elongation was measured after EU incorporation (1 h) 3-day post +/− 2 μg/mL DOX treatment in MCF-7 TR control and MCF7 TR CNOT1KD cells (Representative cells are shown in (H)). To quantify EU incorporation, Hoechst was used to stain the nucleus of cells, generating a nuclear mask. Adobe Photoshop was used to adjust the levels of all panels equally. Quantification of EU signal per nucleus was performed using GraphPad Prism statistical software; (n = 3 independent experiments; >100 cells analysed per repeat; Stats: unpaired t-test, * p < 0.05). (M) Representative Western blot showing the expression level of TBP and the phosphorylation of RNA Polymerase II C-terminal domain (S5) in MCF-7 TR CNOT1KD cells up to 5 days post 2 μg/mL DOX induction. Scale bar in (C,H) = 50 µm. a.u, arbitrary units.
Figure 2
Figure 2
Depletion of CNOT1 leads to increased R-loop formation. (A) Detection of RNA–DNA hybrids using slot blot analysis and S9.6 antibody on gDNA isolated from HeLa cells 72 h post CNOT1 depletion. A ssDNA antibody was used as a loading control (lower panel). (B) Representative Western blot confirms the efficiency of CNOT1 depletion up to 96 h. (C) Co-immunostaining of HeLa cells with S9.6 (green) and nucleolin (red) antibodies 72 h post siRNA transfection and 24 h after recombinant RNase H1 transfection. The nuclear DNA was stained with DAPI. (D) Quantification of S9.6 antibody signal per nucleus after subtraction of nucleolar staining using Image J. Statistical analysis was performed using RStudio statistical software. (n = 3 independent experiments, 100 cells counted per experiment. Stats: Mann–Whitney Wilcoxon Rank Sum). (E) Co-immunostaining of MCF-7 TRCNOT1KD cells with S9.6 (green) and nucleolin (red) antibodies 72 h post +/− 2 μg/mL DOX treatment. (F) Quantification of S9.6 antibody signal per nucleus after subtraction of nucleolar staining using Image J. Statistical analysis was performed using GraphPad Prism statistical software 9.5.1; (n = 3 independent experiments; >100 cells analysed per repeat; Stats: unpaired t-test, * p < 0.05,). (G,H) Representative images show percentage transfection efficiency (21%). Images were collected using an EVOS fluorescence inverted digital microscope. MCF7 Cells were fixed, permeabilized, and labelled with anti-FLAG antibody (green). Percentage transfection efficiency: (fluorescent cells/total number of cells) × 100. Bar 400 µm. (I,J) Representative IF images and bar graph showing the GFP signal obtained from control siRNA, CNOT1 siRNA, CNOT4 siRNA and double CNOT7/8 knock down and in dead-RNH1 U2OS cells. The intensity of GFP signal was equalized across different samples using Image J. Statistical analysis was performed using excel; (n = 3 independent experiments; >100 cells analysed per repeat; Stats: unpaired t-test, * p < 0.05,). Scale bar = 50 µm. AU, arbitrary units. (K,L) Representative Western blot showing the expression of CNOT 1, 7/8 and CNOT4 subunits 3 days post siRNA transfection in In GFP dRNH1 U2OS cells.
Figure 2
Figure 2
Depletion of CNOT1 leads to increased R-loop formation. (A) Detection of RNA–DNA hybrids using slot blot analysis and S9.6 antibody on gDNA isolated from HeLa cells 72 h post CNOT1 depletion. A ssDNA antibody was used as a loading control (lower panel). (B) Representative Western blot confirms the efficiency of CNOT1 depletion up to 96 h. (C) Co-immunostaining of HeLa cells with S9.6 (green) and nucleolin (red) antibodies 72 h post siRNA transfection and 24 h after recombinant RNase H1 transfection. The nuclear DNA was stained with DAPI. (D) Quantification of S9.6 antibody signal per nucleus after subtraction of nucleolar staining using Image J. Statistical analysis was performed using RStudio statistical software. (n = 3 independent experiments, 100 cells counted per experiment. Stats: Mann–Whitney Wilcoxon Rank Sum). (E) Co-immunostaining of MCF-7 TRCNOT1KD cells with S9.6 (green) and nucleolin (red) antibodies 72 h post +/− 2 μg/mL DOX treatment. (F) Quantification of S9.6 antibody signal per nucleus after subtraction of nucleolar staining using Image J. Statistical analysis was performed using GraphPad Prism statistical software 9.5.1; (n = 3 independent experiments; >100 cells analysed per repeat; Stats: unpaired t-test, * p < 0.05,). (G,H) Representative images show percentage transfection efficiency (21%). Images were collected using an EVOS fluorescence inverted digital microscope. MCF7 Cells were fixed, permeabilized, and labelled with anti-FLAG antibody (green). Percentage transfection efficiency: (fluorescent cells/total number of cells) × 100. Bar 400 µm. (I,J) Representative IF images and bar graph showing the GFP signal obtained from control siRNA, CNOT1 siRNA, CNOT4 siRNA and double CNOT7/8 knock down and in dead-RNH1 U2OS cells. The intensity of GFP signal was equalized across different samples using Image J. Statistical analysis was performed using excel; (n = 3 independent experiments; >100 cells analysed per repeat; Stats: unpaired t-test, * p < 0.05,). Scale bar = 50 µm. AU, arbitrary units. (K,L) Representative Western blot showing the expression of CNOT 1, 7/8 and CNOT4 subunits 3 days post siRNA transfection in In GFP dRNH1 U2OS cells.
Figure 3
Figure 3
Depletion of CNOT1 induces replication stress through ongoing transcription. (A) Inhibition of RNA synthesis with DRB in CNOT1-depleted HeLa cells. Cells were treated with CNOT1 or control siRNA. A total of 72 h post siRNA transfection cells were exposed to 100 µM DRB or solvent DMSO for 100 min during EU labelling. (B) Quantification of EU signal per nucleus treated with DRB was performed using RStudio statistical software and shown (n = 3 independent experiments Stats: Mann–Whitney Wilcoxon Rank Sum). Statistical analyses were performed using a two-tailed and unpaired Student’s t test, * p < 0.05, *** p < 0.001 (C,D) Representative Western blot confirms the efficiency of CNOT1 depletion on day 3 following treatment with DMSO or DRB for IF and fibre assay, respectively. (E) Experimental scheme of dual labelling of DNA fibres in HeLa cell lines. (F) Distribution of replication fork speeds 72 h after CNOT1 depletion; HeLa cells were treated with DRB (450 replication forks were examined from three independent experiments). (G) Distribution of replication fork speeds 72 h after CNOT1 depletion in HeLa cells treated with 10 µM PHA- 767491 for 1 h (450 replication forks were examined from three independent experiments). The fibre lengths obtained in Image J were converted into micrometres using the scale bars on the microscope. (H,I) Representative images show percentage transfection efficiency (approximately 25%). Images were collected using an EVOS fluorescence inverted digital microscope. MCF7 Cells were fixed, permeabilized, and labelled with anti-FLAG antibody (green). Percentage transfection efficiency: (fluorescent cells/total number of cells) × 100. Bar 400 µm. (J) Representative image showing fields of DNA fibres in MCF-7 TRCNOT1KD cells. The DNA fibres pictured were labelled sequentially with CldU and IdU for 20 min each. Scale bar = 50 µm. (K) Distribution of replication fork speeds 72 h post +/− 2 μg/mL DOX treatment and 2 days post CNOT1 pcDNA3 transfection. A total of 250 replication forks were examined from three independent experiments. The fibre lengths obtained in Image J were converted into micrometres using the scale bars on the microscope.
Figure 3
Figure 3
Depletion of CNOT1 induces replication stress through ongoing transcription. (A) Inhibition of RNA synthesis with DRB in CNOT1-depleted HeLa cells. Cells were treated with CNOT1 or control siRNA. A total of 72 h post siRNA transfection cells were exposed to 100 µM DRB or solvent DMSO for 100 min during EU labelling. (B) Quantification of EU signal per nucleus treated with DRB was performed using RStudio statistical software and shown (n = 3 independent experiments Stats: Mann–Whitney Wilcoxon Rank Sum). Statistical analyses were performed using a two-tailed and unpaired Student’s t test, * p < 0.05, *** p < 0.001 (C,D) Representative Western blot confirms the efficiency of CNOT1 depletion on day 3 following treatment with DMSO or DRB for IF and fibre assay, respectively. (E) Experimental scheme of dual labelling of DNA fibres in HeLa cell lines. (F) Distribution of replication fork speeds 72 h after CNOT1 depletion; HeLa cells were treated with DRB (450 replication forks were examined from three independent experiments). (G) Distribution of replication fork speeds 72 h after CNOT1 depletion in HeLa cells treated with 10 µM PHA- 767491 for 1 h (450 replication forks were examined from three independent experiments). The fibre lengths obtained in Image J were converted into micrometres using the scale bars on the microscope. (H,I) Representative images show percentage transfection efficiency (approximately 25%). Images were collected using an EVOS fluorescence inverted digital microscope. MCF7 Cells were fixed, permeabilized, and labelled with anti-FLAG antibody (green). Percentage transfection efficiency: (fluorescent cells/total number of cells) × 100. Bar 400 µm. (J) Representative image showing fields of DNA fibres in MCF-7 TRCNOT1KD cells. The DNA fibres pictured were labelled sequentially with CldU and IdU for 20 min each. Scale bar = 50 µm. (K) Distribution of replication fork speeds 72 h post +/− 2 μg/mL DOX treatment and 2 days post CNOT1 pcDNA3 transfection. A total of 250 replication forks were examined from three independent experiments. The fibre lengths obtained in Image J were converted into micrometres using the scale bars on the microscope.
Figure 4
Figure 4
CNOT1-depleted HeLa cells have increased R-loop accumulation. (A) Representative Western blot confirms the efficiency of CNOT1 depletion up to 96 h. (B) Representative bar graph shows the percentage of new origins during DNA fibre labelling 72 h post CNOT1 depletion and 24 h post transfection with pCMV6- AC-RNase H1-GFP or pcDNA 3.1 (450 replication forks were analysed from three independent experiments). Statistical analyses were performed using a two-tailed and unpaired Student’s t test, Error bars represent SD. (C) Distribution of replication fork speeds 24 h post transfection with pCMV6-AC-RNase H1-GFP or pcDNA 3.1 following 72 h CNOT1 depletion (450 replication forks were analysed from three independent experiments. The lengths obtained in Image J were converted into micrometres using the scale bars on the microscope.
Figure 5
Figure 5
Increased genome instability in CNOT1-depleted cells. (A,B) Quantification of cells with >10 γ-H2AX foci in MCF-7 cells 3 days post +/− 2 μg/mL DOX induction. (C,D,H,I) Quantification of siRNA treated HeLa cells and MCF TRCNOT1KD cells with micronuclei classified in two categories (single micronuclei per cell and multiple micronuclei per cell). Scale bars, 5 μm. (n = 3 independent experiments; >100 cells counted per repeat, mean ± SD, * p < 0.05, ** p < 0.01 ). In (C,H) arrows indicate micronuclei. (E,F,J,K) Quantification of CNOT1 siRNA-treated HeLa and MCF TRCNOT1KD cells with 53BP1 nuclear bodies (indicated by arrows in central panel) in G1 positive control as judged by co-staining with either Cyclin A (J) or Mitosin (E) (in E, upper pane, and J, central panel, arrows indicate cells in a particular indicated phase of the cell cycle). (L) The level of DSBs, assessed using neutral comet assay, was performed 120 h post siRNA transfection in control and CNOT1-depleted HeLa cells. Dot plot of Olive tail moments was performed using RStudio statistical software (n = 3 independent experiments; >100 cells analysed per repeat, mean ± SD, ** p < 0.01 and). (M,N) Quantification of chromatid gaps and breaks per 100 metaphase spreads in control and CNOT1-depleted HeLa cells (* p < 0.05 and ** p < 0.005; n = 3). Scale bar = 50 µm. (G) Representative Western blot confirms the efficiency of CNOT1 depletion on day 3.
Figure 5
Figure 5
Increased genome instability in CNOT1-depleted cells. (A,B) Quantification of cells with >10 γ-H2AX foci in MCF-7 cells 3 days post +/− 2 μg/mL DOX induction. (C,D,H,I) Quantification of siRNA treated HeLa cells and MCF TRCNOT1KD cells with micronuclei classified in two categories (single micronuclei per cell and multiple micronuclei per cell). Scale bars, 5 μm. (n = 3 independent experiments; >100 cells counted per repeat, mean ± SD, * p < 0.05, ** p < 0.01 ). In (C,H) arrows indicate micronuclei. (E,F,J,K) Quantification of CNOT1 siRNA-treated HeLa and MCF TRCNOT1KD cells with 53BP1 nuclear bodies (indicated by arrows in central panel) in G1 positive control as judged by co-staining with either Cyclin A (J) or Mitosin (E) (in E, upper pane, and J, central panel, arrows indicate cells in a particular indicated phase of the cell cycle). (L) The level of DSBs, assessed using neutral comet assay, was performed 120 h post siRNA transfection in control and CNOT1-depleted HeLa cells. Dot plot of Olive tail moments was performed using RStudio statistical software (n = 3 independent experiments; >100 cells analysed per repeat, mean ± SD, ** p < 0.01 and). (M,N) Quantification of chromatid gaps and breaks per 100 metaphase spreads in control and CNOT1-depleted HeLa cells (* p < 0.05 and ** p < 0.005; n = 3). Scale bar = 50 µm. (G) Representative Western blot confirms the efficiency of CNOT1 depletion on day 3.
Figure 6
Figure 6
CNOT1 depletion leads to down regulation of ATR/Chk1 and activation of ATM/Chk2 repair pathways. (A) Western blot showing the expression and phosphorylation of ATR, ATRIP, Chk1, RPA in control and CNOT1 depleted HeLa cells up to 4 days post siRNA transfection. Actin was used as a loading control. (B,C) Quantification of cells with >10RPA foci in both +/− CENPF control and CNOT1 depleted HeLa cells up to 3 days post siRNA transfect ion. (D,E) Western blot showing the expression level of total ATM, Chk2, H2AX, KAP1 in HeLa and MCF7 cells up to 4 days siRNA transfection and 3 days post DOX treatment, respectively.
Figure 7
Figure 7
DNA damage-induced cell cycle arrest and senescence in CNOT1-depleted HeLa cells. (A,B) Up- and downregulated genes 72 h post CNOT1 siRNA treatment in HeLa cells. (CE) Representative immunoblots showing the comparative protein expression between control and CNOT1-depleted HeLa cells. GAPDH and CDK2 were used as loading controls. (F,G) HeLa cells were transfected with either Control or CNOT1 siRNA and stained with PI and the cell cycle profiles analysed by flow cytometry at different time-points post-transfection. Representative profiles of the cells 72 h post transfection are shown. (H) HeLa cells were plated at appropriate concentrations 72 h post CNOT1 and control siRNA transfection. At day 14, large colonies were stained with crystal violet and counted. (I) Bar graph shows the plating efficiency of the cells at day 14 after staining with crystal violet (n = 3 independent experiments). Statistical analyses were performed using a two-tailed and unpaired Student’s t test, ***, p < 0.001. Error bars represent SD. (J) Representative images showing the development of SA-β-Gal staining (positive senescent cells) in control HeLa cells (upper panel) and CNOT1-depleted HeLa cells (lower panel) between day 3 (left panel) and day 7 (right panel) post siRNA transfection. The blue color represents senescent cells. Scale bar = 50 μm. (K) Bar graphs showing the percentage of SA-β-Gal positive cells in control and CNOT1-depleted HeLa cells 3-, 5- and 7-days post siRNA depletion (n = 3 independent experiments). Statistical analyses were performed using a two-tailed and unpaired Student’s t test, * p < 0.05. Error bars represent SD.
Figure 7
Figure 7
DNA damage-induced cell cycle arrest and senescence in CNOT1-depleted HeLa cells. (A,B) Up- and downregulated genes 72 h post CNOT1 siRNA treatment in HeLa cells. (CE) Representative immunoblots showing the comparative protein expression between control and CNOT1-depleted HeLa cells. GAPDH and CDK2 were used as loading controls. (F,G) HeLa cells were transfected with either Control or CNOT1 siRNA and stained with PI and the cell cycle profiles analysed by flow cytometry at different time-points post-transfection. Representative profiles of the cells 72 h post transfection are shown. (H) HeLa cells were plated at appropriate concentrations 72 h post CNOT1 and control siRNA transfection. At day 14, large colonies were stained with crystal violet and counted. (I) Bar graph shows the plating efficiency of the cells at day 14 after staining with crystal violet (n = 3 independent experiments). Statistical analyses were performed using a two-tailed and unpaired Student’s t test, ***, p < 0.001. Error bars represent SD. (J) Representative images showing the development of SA-β-Gal staining (positive senescent cells) in control HeLa cells (upper panel) and CNOT1-depleted HeLa cells (lower panel) between day 3 (left panel) and day 7 (right panel) post siRNA transfection. The blue color represents senescent cells. Scale bar = 50 μm. (K) Bar graphs showing the percentage of SA-β-Gal positive cells in control and CNOT1-depleted HeLa cells 3-, 5- and 7-days post siRNA depletion (n = 3 independent experiments). Statistical analyses were performed using a two-tailed and unpaired Student’s t test, * p < 0.05. Error bars represent SD.
Figure 8
Figure 8
Proposed model showing how disruption of the CCR4–Not complex contributes to transcription-mediated genome instability via RNA–DNA hybrids’ formation. Red arrow indicates an increase.

References

    1. Chen J., Rappsilber J., Chiang Y.-C., Russell P., Mann M., Denis C.L. Purification and characterization of the 1.0 MDa CCR4-NOT complex identifies two novel components of the complex. J. Mol. Biol. 2001;314:683–694. doi: 10.1006/jmbi.2001.5162. - DOI - PubMed
    1. Denis C.L., Chen J. The CCR4–NOT Complex Plays Diverse Roles in mRNA Metabolism. Prog. Nucleic Acid Res. Mol. Biol. 2003;73:221–250. doi: 10.1016/s0079-6603(03)01007-9. - DOI - PubMed
    1. Kruk J.A., Dutta A., Fu J., Gilmour D.S., Reese J.C. The multifunctional Ccr4–Not complex directly promotes transcription elongation. Genes Dev. 2011;25:581–593. doi: 10.1101/gad.2020911. - DOI - PMC - PubMed
    1. Collart M.A., Panasenko O.O. The Ccr4–not complex. Gene. 2012;492:42–53. doi: 10.1016/j.gene.2011.09.033. - DOI - PubMed
    1. Inada T., Makino S. Novel roles of the multi-functional CCR4-NOT complex in post-transcriptional regulation. Front. Genet. 2014;5:135. doi: 10.3389/fgene.2014.00135. - DOI - PMC - PubMed

Publication types