. 2023 Jul 17;12(14):1869.
doi: 10.3390/cells12141869.

Prox1 Suppresses the Proliferation of Breast Cancer Cells via Direct Inhibition of c-Myc Gene Expression

Affiliations

Prox1 Suppresses the Proliferation of Breast Cancer Cells via Direct Inhibition of c-Myc Gene Expression

Artemis Michail et al. Cells. .

Abstract

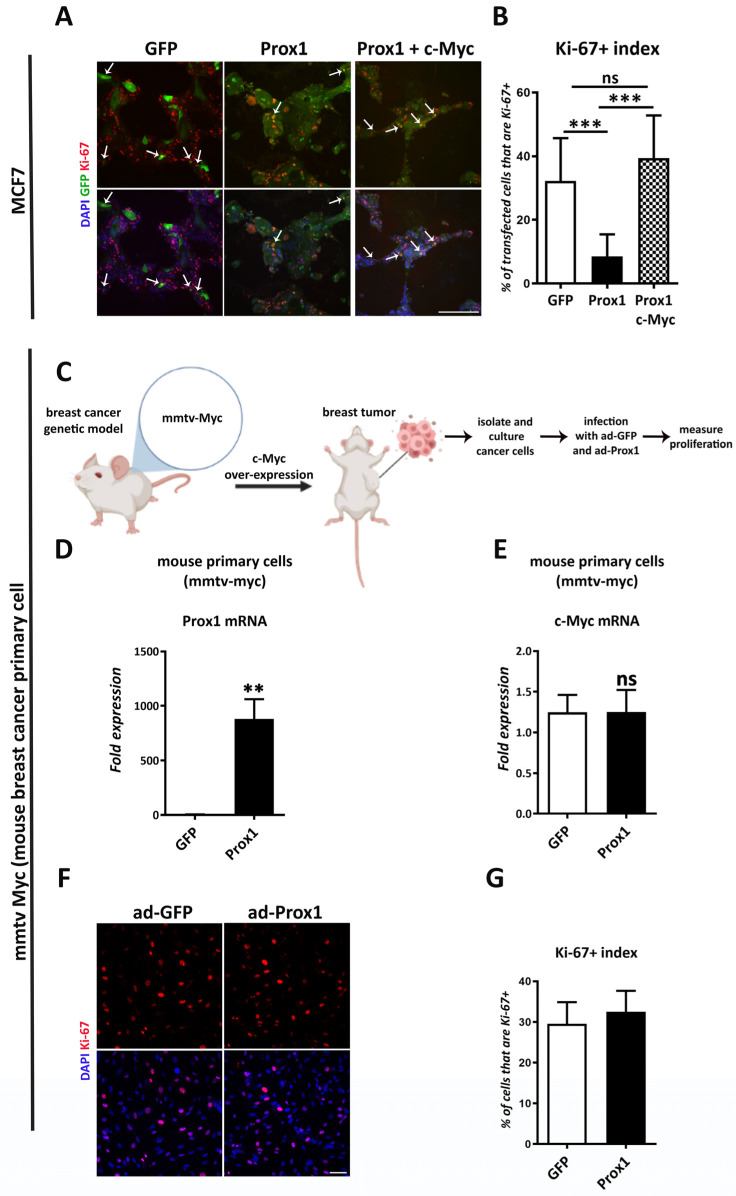
Breast cancer is one of the most lethal malignancies in women worldwide and is characterized by rapid growth and low survival rates, despite advances in tumor biology and therapies. Novel therapeutic approaches require new insights into the molecular mechanisms of malignant transformation and progression. To this end, here, we identified Prox1 as a negative regulator of proliferation and tumor-related metabolism in breast cancer. In particular, we showed that breast tumors from human patients exhibited reduced levels of Prox1 expression, while high expression levels of Prox1 were associated with a favorable prognosis in breast cancer patients. Moreover, we experimentally demonstrated that Prox1 was sufficient to strongly suppress proliferation, migration, and the Warburg effect in human breast cancer cells without inducing apoptosis. Most importantly, over-expression of Prox1 inhibited breast tumor growth in vivo in both heterotopic and orthotopic xenograft mouse models. The anti-tumorigenic effect of Prox1 was mediated by the direct repression of c-Myc transcription and its downstream target genes. Consistently, c-Myc over-expression from an artificial promoter that was not targeted by Prox1 reversed Prox1's anti-tumor effects. These findings suggest that Prox1 has a tumor suppressive role via direct transcriptional regulation of c-Myc, making it a promising therapeutic gene for breast cancer.

Keywords: MPC1; PDK1; Warburg effect; gene regulation; metabolism.


Conflict of interest statement

The authors declare no potential conflict of interest.

Figures

Figure 1
Figure 1
Prox1 expression is correlated with a favorable prognosis in breast cancer patients. (A) Expression of Prox1 mRNA in normal breast tissue and breast carcinoma. These data were downloaded from the Oncomine database and based on the TCGA data. p values for each comparison are indicated below the corresponding graph. (B) Graphical representation (violin plot) of Prox1 expression in breast tumors (n = 7569) and healthy adjacent breast tissue (n = 242) p < 0.001 (https://tnmplot.com, accessed on 1 October 2021). (C) Survival curve (Kaplan–Meier) of breast cancer patients with relative high and low expression of Prox1 from the KM-plotter (https://kmplot.com, accessed on 1 October 2021), p < 0.05.
Figure 2
Figure 2
Prox1 inhibits proliferation of human breast cancer cells. (A) Prox1 and GFP-transfected MDA-MB-231 cells were treated with BrdU for 2 h and then stained with BrdU antibody (red) and labeled with DAPI (blue). Arrows indicate representative double positive cells (GFP positive and BrdU positive). Arrowheads indicate representative Prox1 transfected cells that are negative for BrdU. Larger magnifications of the areas included in the square shapes are presented in the micrographs next to each image. Scale bar: 75 μM. (B) Quantification of BrdU incorporation in transgene-positive MDA-MB-231 cells (GFP: 48.87255 ± 3.951479% vs. Prox1: 16.32653 ± 6.611298%, p < 0.01) (C) Quantification of BrdU incorporation in transgene-negative MDA-MB-231 cells (GFP: 46.07843 ± 8.008329% vs. Prox1: 37.04561 ± 3.412163%, p > 0.1). (D) Prox1 and GFP-transfected MDA-MB-231 cells were immunostained for pH3 (grey) and labeled with DAPI (blue). Arrows indicate representative double positive cells (GFP positive and pH3 positive). Arrowheads indicate representative Prox1 transfected cells that are negative for pH3. Larger magnifications of the areas included in the square shapes are presented in the micrographs next to each image. Scale bar: 75 μM. (E) Quantification of pH3-positive cells in transgene-positive MDA-MB-231 cells (GFP: 5 ± 2.659148% vs. Prox1: 0.2 ± 0.1%, p < 0.01). (F) Quantification of pH3-positive cells in transgene-negative MDA MB 231 cells (GFP: 10 ± 3.618435% vs. Prox1: 17.24138 ± 4.251835%, p > 0.1. (G) Quantification of BrdU incorporation in transgene-positive MCF7 cells (GFP: 22.51497 ± 7.616616% vs. Prox1: 2.066682 ± 1.49425%, p < 0.001). (H) Quantification of BrdU incorporation in transgene-negative MCF7 cells (GFP: 37.72455 ± 13.398910% vs. Prox1: 46.96707 ± 14.93805%, p > 0.1). (I) Quantification of pH3-positive cells in transgene-positive MCF7 cells (GFP: 3.353293 ± 1.13362% vs. Prox1: 0.8794391 ± 0.5358448%, p < 0.01). (J) Quantification of pH3-positive cells in transgene-negative MCF7 cells (GFP: 4.790419 ± 3.281816% vs. Prox1: 9.532062 ± 6.67863%, p > 0.1). For all cases, ** p < 0.01.
Figure 3
Figure 3
Prox1 suppresses the migration of human breast cancer cells. (A) Prox1 and GFP-infected MDA-MB-231 cells were measured for their migration capacity using the wound healing assay, at 24 and 48 h. (B) Quantification of the % average wound closure at 24 h in MDA-MB-231 cells in GFP and Prox1 over-expression conditions. (GFP: 52.99 ± 16.22% vs. Prox1: 12.02 ± 8.312%, p < 0.05). (C) Quantification of the % average wound closure at 48 h in MDA-MB-231 cells in GFP and Prox1 over-expression conditions (GFP: 56.76 ± 11.05% vs. Prox1: 28.31 ± 4.419%, p < 0.05). (D) Prox1 and GFP-infected MDA-MB-231 cells were measured for their cell invasion capacity using the transwell assay. Arrowheads indicate cells after invasion on the membrane of the transwell. (E) Quantification of the invasive cell number in MDA-MB-231 cells in GFP and Prox1 over-expression conditions (GFP: 100.0 ± 16.66% vs. Prox1: 40.11 ± 9.935%, p < 0.01). (F) Quantification of the % average wound closure at 24 h in MCF7 cells in GFP and Prox1 over-expression conditions (GFP: 58.39 ± 10.17% vs. Prox1: 18.62 ± 4.091%, p < 0.01) (G) Quantification of the % average wound closure at 48 h in MCF7 cells in GFP and Prox1 over-expression conditions (GFP: 70.29 ± 9.186% vs. Prox1: 35.39 ± 13.39%, p < 0.05) (H) Quantification of the invasive cell number in MCF7 cells in GFP and Prox1 over-expression conditions (GFP: 115.3 ± 6.242% vs. Prox1: 58.11 ± 16.14%, p < 0.01). For all cases, * p < 0.05, ** p < 0.01.
Figure 4
Figure 4
Prox1 over-expression reduces glucose and lactate production in the supernatant of human breast cancer cells. (A) Schematic representation of the experimental design, using the Biorender biotool. (B) Quantification of glucose in supernatant of MDA-MB-231 cells in GFP and Prox1 over-expression conditions. Measurements were conducted for three days in a row without changing the medium. The data are expressed as % of GFP condition in day 1 (GFP day1: 100.077 ± 1.97% vs. Prox1 day1: 114.801 ± 9.962%, p > 0.05; GFP day2: 90.184 ± 2.761% vs. Prox1 day2: 100.613 ± 2.316%, p < 0.05; GFP day3: 79.141 ± 5.598% vs. Prox1 day3: 96.319 ± 1.406%, p < 0.05). (C) Quantification of lactate in the supernatant of MDA-MB-231 cells in GFP and Prox1 over-expression conditions. Measurements were conducted for three days in a row without changing the medium. The data are expressed as % of GFP condition in day 1 (GFP day1: 99.712 ± 13.456% vs. Prox1 day1: 100 ± 0.511%, p > 0.05; GFP day2: 157.981 ± 0.982% vs. Prox1 day2: 120.123 ± 3.756%, p < 0.05; GFP day3: 232.244 ± 10.260% vs. Prox1 day3: 193.227 ± 19.270%, p < 0.05). (D) Quantification of glucose in the supernatant of MCF7 cells in GFP and Prox1 over-expression experimental conditions. Measurements were conducted for three days in a row without changing the medium. The data are expressed as % of GFP condition in day 1 (GFP day1: 100 ± 4.792% vs. Prox1 day1: 103.233 ± 4.923%, p > 0.05; GFP day2: 51.324 ± 4.636% vs. Prox1 day2: 69.592 ± 0.440%, p < 0.05; GFP day3: 22.374 ± 3.849% vs. Prox1 day3: 36.677 ± 1.995%, p < 0.05). (E) Quantification of lactate in the supernatant of MCF7 cells in GFP and Prox1 over-expression conditions. Measurements were conducted for three days in a row without changing the medium. The data are expressed as % of GFP condition in day 1 (GFP day1: 100 ± 22.803% vs. Prox1 day1: 102.566 ± 18.520%, p > 0.05; GFP day2: 121.372 ± 6.029% vs. Prox1 day2: 101.022 ± 1.233%, p < 0.05; GFP day3: 124.248 ± 3.908% vs. Prox1 day3: 104.120 ± 2.991%, p < 0.05). For all cases, ns (non-significant) for p > 0.05, * p < 0.05.
Figure 5
Figure 5
Prox1 inhibits expression of genes that promote the Warburg effect. mRNA expression analysis of genes critically involved in tumor development in MCF7 cells over-expressing GFP or Prox1. Relative expression levels of FOXA, EGFR, IRS1, mTOR, HES1, STAT3, p53, p16, p21, p27, CYCLIN D1, CYCLIN E, c-MYC, GAPDH, GLUT1, GLUT3, HK2, PDK1, ENO2, TIGAR, COX4i, MPC1, and NDUFA7 mRNA in GFP and Prox1 over-expression conditions, measured with quantitative real time RT-PCR. The red square highlights the genes that alter significantly their expression pattern. For all cases, ** p < 0.01, *** p < 0.001.
Figure 6
Figure 6
Prox1 directly suppresses c-Myc expression both in transcriptional and translational level. (A) Western blot analysis of c-Myc and b-actin in MDA-MB-231 cells in GFP and Prox1 over-expression conditions. (B) Quantification of protein expression levels of c-Myc in MDA-MB-231 cells in GFP and Prox1 over-expression conditions, p < 0.01. (C) Relative expression of c-Myc mRNA in MDA-MB-231 cells in GFP and Prox1 over-expression conditions, measured with quantitative real time RT-PCR, p < 0.001. (D) Prox1 and GFP-infected MDA-MB-231 cells were immunostained for c-Myc (red) and labeled with DAPI (blue). Scale bar: 75 μM. (Ε) Quantification of c-Myc positive cells over all cells in Prox1 and GFP-infected MDA-MB-231 cells (GFP: 28.78 ± 5.604% vs. Prox1: 15.71 ± 5.471%, p < 0.05). (F) Western blot analysis of c-Myc and b-actin in MCF7 cells in GFP and Prox1 over-expression conditions. (G) Quantification of protein expression levels of c-Myc in MCF7 cells in GFP and Prox1 over-expression conditions, p < 0.01. (H) Relative expression of c-Myc mRNA in MCF7 cells in GFP and Prox1 over-expression conditions, measured with quantitative real time RT-PCR, p < 0.01. (I) Prox1 and GFP-infected MCF7 cells were immunostained for c-Myc (red) and labeled with DAPI. Scale bar: 75 μM. (J) Quantification of c-Myc positive cells over all cells in Prox1 and GFP-infected MCF7 cells (GFP: 52.22 ± 1.217% vs. Prox1: 25.56 ± 1.217%, p < 0.05). For all cases, * p < 0.05, ** p < 0.01, *** p < 0.001 (K) Schematic representation of the c-Myc gene locus around the transcription start site (denoted with the broken arrow). The exons of the c-Myc gene are represented as black boxes. The genomic loci that we tested in ChIP experiments are shown with red lines. (L) ChIP analysis of the binding sites of Prox1 to c-Myc gene locus. ChIP experiments were performed using anti-Prox1 (a-Prox1) or a control antibody (IgG) in chromatin isolated from MDA-MB-231 cells over-expressing Prox1. For a-Prox1 and IgG reactions, the same amount of DNA was used as a template. The primers pairs used to amplify the corresponding DNA sequences are indicated with specific loci letters. Letters denote the distance from the transcription start site. Note that Prox1 specifically binds to the loci B, D and F (these loci are noted with red color). (M) Schematic representation of Prox1 directly suppressing c-Myc transcription.
Figure 7
Figure 7
c-Myc over-expression rescues the Prox1-driven anti-proliferative effect of breast cancer cells. (A) Prox1, GFP, and Prox1 + c-Myc transfected MCF7 cells were immunostained for Ki-67 (red) and labeled with DAPI (blue). Arrowheads indicate representative double positive cells (GFP positive and Ki-67 positive or Prox1 and Ki-67 positive cells). Scale bar: 250 μM. (B) Quantification of Ki-67 positive cells in transgene-positive MCF7 cells (GFP% 32.18 ± 13.46% vs. Prox1: 8.511 ± 6.949%, p < 0.001; Prox1: 8.511 ± 6.949% vs. Prox1 + c-Myc: 42.78 ± 9.431%, p < 0.001). (C) Schematic representation of the in vivo breast cancer genetic mouse model and experimental design, using the Biorender biotool. (D) Relative expression levels of Prox1 mRNA in mouse breast cancer primary cells in GFP and Prox1 over-expression conditions, measured with quantitative real time RT-PCR, p < 0.01. (E) Relative expression levels of c-Myc mRNA in mouse breast cancer primary cells in GFP and Prox1 over-expression conditions, measured with quantitative real time RT-PCR, p > 0.1. (F) Prox1 and GFP-infected mouse breast cancer primary cells were immunostained for Ki-67 (red) and labeled with DAPI (blue). Scale bar: 75 μΜ. (G) Quantification of Ki-67 positive cells over all cells in mouse breast cancer primary cells in GFP and Prox1 over-expression conditions (GFP: 29.55 ± 5.333% vs. Prox1: 32.54 ± 5.157%, p > 0.1). For all cases, ns (non-significant) for p > 0.05, ** p < 0.01, *** p < 0.001.
Figure 8
Figure 8
Prox1 inhibits proliferation of human breast cancer cells in vivo. (A) Schematic representation of the in vivo orthotopic breast cancer mouse model, using the Biorender biotool. (B) Representative images of whole tumors that were grown in NOD/SCID animals mammary pads using MDA-MB-231 cells over-expressing GFP or Prox1. (C) Quantification of the tumor growth after the orthotopic injections of MDA-MB-231 cells over-expressing GFP and Prox1, as indicated. (D) Quantification of the tumor weight of the tumors over-expressing GFP and Prox1 (GFP: 0.2060 ± 0.04526 g vs. Prox1: 0.05900 ± 0.02923 g, p < 0.0001). (E) Tumor sections of MDA-MB-231 cells over-expressing GFP and Prox1 were labeled for Ki-67 (red) and DAPI (blue). Tumors were collected at the end of the experiment. Scale bar: 40 μM. (F) Quantification of the Ki-67 index in GFP and Prox1 treated tumors (GFP: 27.22 ± 6.206% vs. Prox1: 18.89 ± 3.752%, p < 0.05). (G) Tumor sections of MDA-MB-231 cells over-expressing GFP and Prox1 were labeled for pH3 (red) and DAPI (blue). Tumors were collected at the end of the experiment. Scale bar: 40 μM. (H) Quantification of the pH3 index in GFP and Prox1 treated tumors (GFP: 3.667 ± 1.394% vs. Prox1: 0.3333 ± 0.7454%, p < 0.01). (I) Tumor sections of MDA-MB-231 cells over-expressing GFP and Prox1 were labeled for c-Myc (red) and DAPI (blue). Tumors were collected at the end of the experiment. Scale bar: 75 μM. (J) Quantification of the c-Myc index in GFP and Prox1-treated tumors (GFP: 21.67 ± 4.859% vs. Prox1: 13.00 ± 4.314%, p < 0.05). For all cases, * p < 0.05, ** p < 0.01.
Figure 9
Figure 9
Proposed model of Prox1 anti-tumorigenic mechanism in breast cancer. Depiction of Prox1 inhibitory action on c-Myc and its effectors on Warburg effect. The negative effect of Prox1 on c-Myc gene expression represses tumor growth and metastasis.

References

    1. Wigle J.T., Chowdhury K., Gruss P., Oliver G. Prox1 function is crucial for mouse lens-fibre elongation. Nat. Genet. 1999;21:318–322. doi: 10.1038/6844. - DOI - PubMed
    1. Risebro C.A., Searles R.G., Melville A.A., Ehler E., Jina N., Shah S., Pallas J., Hubank M., Dillard M., Harvey N.L., et al. Prox1 maintains muscle structure and growth in the developing heart. Development. 2009;136:495–505. doi: 10.1242/dev.030007. - DOI - PMC - PubMed
    1. Kaltezioti V., Kouroupi G., Oikonomaki M., Mantouvalou E., Stergiopoulos A., Charonis A., Rohrer H., Matsas R., Politis P.K. Prox1 regulates the notch1-mediated inhibition of neurogenesis. PLoS Biol. 2010;8:e1000565. doi: 10.1371/journal.pbio.1000565. - DOI - PMC - PubMed
    1. Sosa-Pineda B., Wigle J.T., Oliver G. Hepatocyte migration during liver development requires Prox1. Nat. Genet. 2000;25:254–255. doi: 10.1038/76996. - DOI - PubMed
    1. Kaltezioti V., Foskolou I.P., Lavigne M.D., Ninou E., Tsampoula M., Fousteri M., Margarity M., Politis P.K. Prox1 inhibits neurite outgrowth during central nervous system development. Cell. Mol. Life Sci. CMLS. 2021;78:3443–3465. doi: 10.1007/s00018-020-03709-2. - DOI - PMC - PubMed

Publication types