. 2023 Jul 5;10(7):808.
doi: 10.3390/bioengineering10070808.

Model-Based Characterization of E. coli Strains with Impaired Glucose Uptake

Affiliations

Model-Based Characterization of E. coli Strains with Impaired Glucose Uptake

Niels Krausch et al. Bioengineering (Basel). .

Abstract

The bacterium Escherichia coli is a widely used organism in biotechnology. For high space-time yields, glucose-limited fed-batch technology is the industry standard; this is because an overflow metabolism of acetate occurs at high glucose concentrations. As an interesting alternative, various strains with limited glucose uptake have been developed. However, these have not yet been characterized under process conditions. To demonstrate the efficiency of our previously developed high-throughput robotic platform, in the present work, we characterized three different exemplary E. coli knockout (KO) strains with limited glucose uptake capacities at three different scales (microtiter plates, 10 mL bioreactor system and 100 mL bioreactor system) under excess glucose conditions with different initial glucose concentrations. The extensive measurements of growth behavior, substrate consumption, respiration, and overflow metabolism were then used to determine the appropriate growth parameters using a mechanistic mathematical model, which allowed for a comprehensive comparative analysis of the strains. The analysis was performed coherently with these different reactor configurations and the results could be successfully transferred from one platform to another. Single and double KO mutants showed reduced specific rates for substrate uptake qSmax and acetate production qApmax; meanwhile, higher glucose concentrations had adverse effects on the biomass yield coefficient YXSem. Additional parameters compared to previous studies for the oxygen uptake rate and carbon dioxide production rate indicated differences in the specific oxygen uptake rate qOmax. This study is an example of how automated robotic equipment, together with mathematical model-based approaches, can be successfully used to characterize strains and obtain comprehensive information more quickly, with a trade-off between throughput and analytical capacity.

Keywords: high throughput; laboratory automation; model-based; strain characterization.


Conflict of interest statement

The authors declare no conflict of interest.

Figures

Figure 1
Figure 1
Glucose uptake systems involved in the KO strains used in this work. Glucose reaches the periplasm in a passive form through porins (blue), such as OmpC, OmpF, and LamB, or through active transport. Such active transport to the cytoplasm can occur via PEP-dependent PTS for glucose (PTSGlc in purple), mannose (PTSMan in gold), and proton-driven symporter GalP (in green). PEP-dependent PTS glucose transport starts when EI is phosphorylated by phosphoenolpyruvate (PEP). The phosphorylation reaches Hpr and, finally, the EII complex, where the substrate is both phosphorylated and translocated. If glucose is taken up by GalP, glucokinase phosphorylates glucose in the cytoplasm (not shown). The dotted lines indicate phosphorylation reactions.
Figure 2
Figure 2
Visualization of the workflow across several cultivation platforms in a digitized and automated lab. By using different platforms, this approach offers the possibility to resolve the contradiction between throughput and knowledge gain by leveraging data from different sources and using them for further process analysis.
Figure 3
Figure 3
Measured online DOT values for batch cultivations of E. coli WG (green), WGP (orange), and WGM (blue) in 24-well OxoDish MTPs with 20 g L−1, 10 g L−1, and 5 g L−1 initial glucose concentrations (indicated by the number after the strain name). The differences in the length of the batch phases are highlighted by the sudden increase in DOT after glucose depletion. Strain WGM also exhibited a longer lag phase prior to growth. Dissolved oxygen tension, DOT; microtiter plate, MTP.
Figure 4
Figure 4
Cultivation data from strains WG, WGP, and WGM from the 2mag platform for 10 and 5 g L−1. Dashed vertical lines indicate glucose pulses where the cultivation was pulsed to the original glucose concentration. Different colors indicate the three replicate reactors.
Figure 5
Figure 5
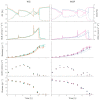
Measured online and atline values for batch cultivations of E. coli WG (left) and WGP (right) as biological duplicates (each color referring to one of the duplicates). Measured online values for O2 (solid) and CO2 (dashed) and corresponding online values for OUR (solid) and CPR (dashed) derived from off-gas analysis. Measured atline values for biomass (circle) and online values for biomass estimated from OUR (dashed, initial parameters from 2mag; line, updated parameters from BioXplorer), acetic acid (triangle), and glucose (square). Error bars derived from triplicates (n = 3). Oxygen uptake rate, OUR; carbon dioxide production rate, CPR.

References

    1. Huang C.-J., Lin H., Yang X. Industrial production of recombinant therapeutics in Escherichia coli and its recent advancements. J. Ind. Microbiol. Biotechnol. 2012;39:383–399. doi: 10.1007/s10295-011-1082-9. - DOI - PubMed
    1. Rosano G.L., Ceccarelli E.A. Recombinant protein expression in Escherichia coli: Advances and challenges. Front. Microbiol. 2014;5:172. doi: 10.3389/fmicb.2014.00172. - DOI - PMC - PubMed
    1. Neubauer P., Cruz Bournazou M.N., Glauche F., Junne S., Knepper A., Raven M. Consistent development of bioprocesses from microliter cultures to the industrial scale. Eng. Life Sci. 2013;13:224–238. doi: 10.1002/elsc.201200021. - DOI
    1. Pan J.G., Rhee J.S., Lebeault J.M. Physiological constraints in increasing biomass concentration of Escherichia coli B in fed-batch culture. Biotechnol. Lett. 1987;9:89–94. doi: 10.1007/BF01032744. - DOI
    1. Xu B., Jahic M., Enfors S.O. Modeling of overflow metabolism in batch and fed-batch cultures of Escherichia coli. Biotechnol. Prog. 1999;15:81–90. doi: 10.1021/bp9801087. - DOI - PubMed