. 2023 Jul 18;10(7):849.
doi: 10.3390/bioengineering10070849.

Perfusion of MC3T3E1 Preosteoblast Spheroids within Polysaccharide-Based Hydrogel Scaffolds: An Experimental and Numerical Study at the Bioreactor Scale

Affiliations

Perfusion of MC3T3E1 Preosteoblast Spheroids within Polysaccharide-Based Hydrogel Scaffolds: An Experimental and Numerical Study at the Bioreactor Scale

Jérôme Grenier et al. Bioengineering (Basel). .

Abstract

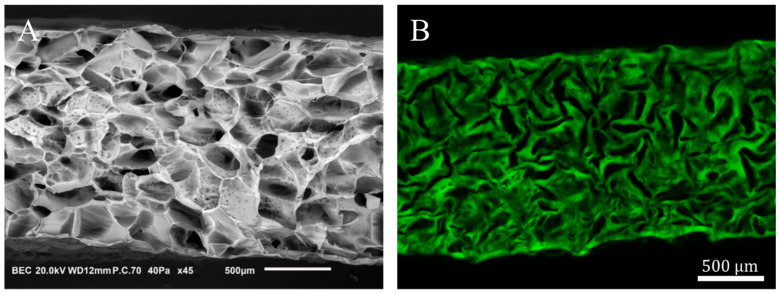
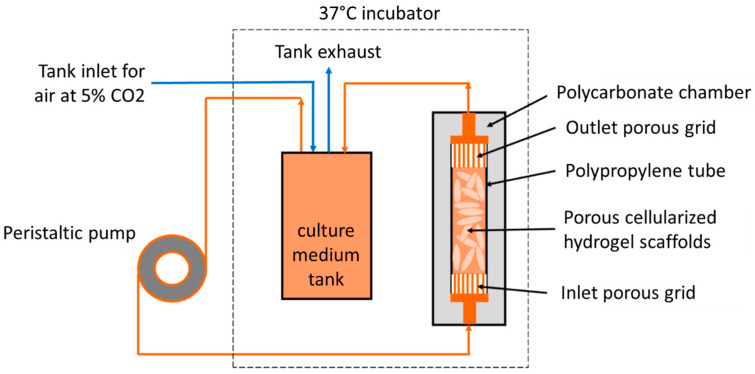
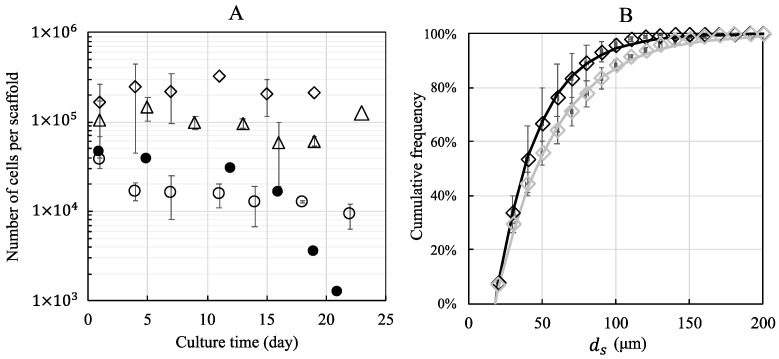
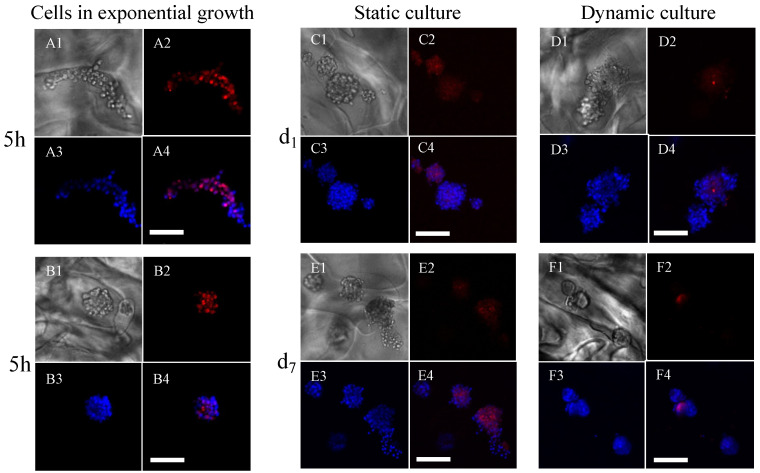
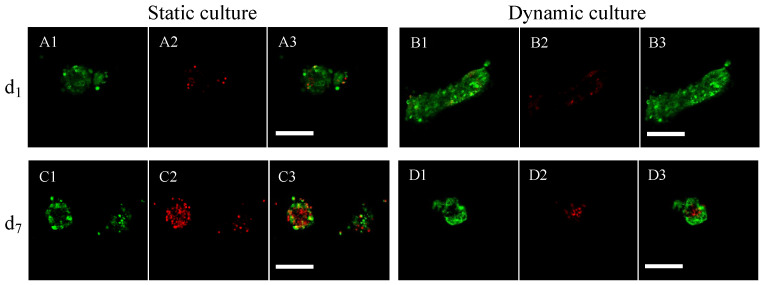
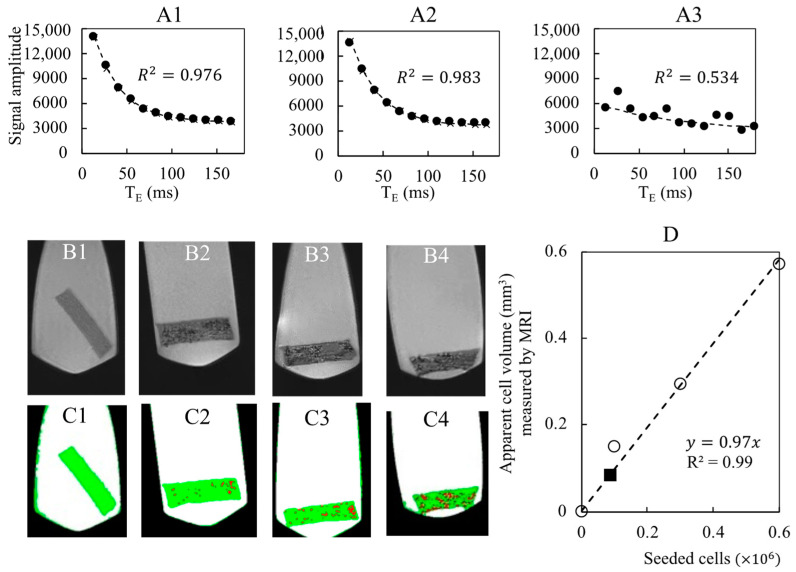
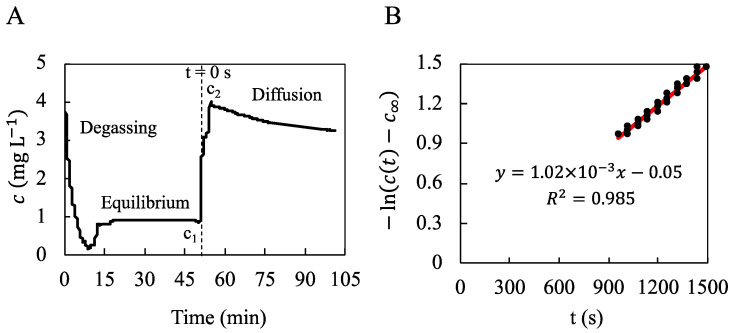
The traditional 3D culture systems in vitro lack the biological and mechanical spatiotemporal stimuli characteristic to native tissue development. In our study, we combined porous polysaccharide-based hydrogel scaffolds with a bioreactor-type perfusion device that generates favorable mechanical stresses while enhancing nutrient transfers. MC3T3E1 mouse osteoblasts were seeded in the scaffolds and cultivated for 3 weeks under dynamic conditions at a perfusion rate of 10 mL min-1. The spatial distribution of the cells labeled with superparamagnetic iron oxide nanoparticles was visualized by MRI. Confocal microscopy was used to assess cell numbers, their distribution inside the scaffolds, cell viability, and proliferation. The oxygen diffusion coefficient in the hydrogel was measured experimentally. Numerical simulations of the flow and oxygen transport within the bioreactor were performed using a lattice Boltzmann method with a two-relaxation time scheme. Last, the influence of cell density and spheroid size on cell oxygenation was investigated. The cells spontaneously organized into spheroids with a diameter of 30-100 μm. Cell viability remained unchanged under dynamic conditions but decreased under static culture. The cell proliferation (Ki67 expression) in spheroids was not observed. The flow simulation showed that the local fluid velocity reached 27 mm s-1 at the height where the cross-sectional area of the flow was the smallest. The shear stress exerted by the fluid on the scaffolds may locally rise to 100 mPa, compared with the average value of 25 mPa. The oxygen diffusion coefficient in the hydrogel was 1.6×10⁻⁹ m2 s-1. The simulation of oxygen transport and consumption confirmed that the cells in spheroids did not suffer from hypoxia when the bioreactor was perfused at 10 mL min-1, and suggested the existence of optimal spheroid size and spacing for appropriate oxygenation. Collectively, these findings enabled us to define the optimal conditions inside the bioreactor for an efficient in vitro cell organization and survival in spheroids, which are paramount to future applications with organoids.

Keywords: 3D cell culture; fluid dynamics; lattice Boltzmann method; organoids; oxygen transport; perfusion bioreactor; porous hydrogel; spheroids.


Conflict of interest statement

Didier Letourneur has shares in SILTISS Company which holds four patents on these scaffolds for tissue engineering.

Figures

Figure 1
Figure 1
Porous polysaccharide-based hydrogel scaffold. (A): XZ cross-section of a freeze-dried scaffold acquired by scanning electron microscopy. (B): CLSM XZ cross-section of a porous hydrogel scaffold swollen in DPBS. The cross-sections (A,B) are not whole in the X-direction.
Figure 2
Figure 2
Schematic diagram of the perfusion bioreactor system.
Figure 3
Figure 3
Picture of the experimental device for measuring the diffusion coefficient of oxygen in the hydrogel.
Figure 4
Figure 4
The number of MC3T3E1 preosteoblasts and cumulative distribution of spheroid diameters within porous hydrogel scaffolds under static (full symbols) and dynamic conditions (empty symbols). The initial cell seeding was 100,000 (empty and full circles), 300,000 (empty triangles), and 600,000 (empty diamonds) cells per scaffold. (A): The number of cells per scaffold as a function of culture time, evaluated from 370-μm depth measurement and extrapolated to the total thickness of the scaffold (1.4 mm). (B): The cumulative (number-average) distribution of spheroid diameters for an initial seeding of 600.000 cells, 24 h post-seeding (black diamonds) and after 14 days of dynamic culture (grey diamonds). Data points were fitted by Equation (1) using least squares method. The error bars represent the standard deviation of the mean calculated for 3 scaffolds from the same bioreactor (n = 3).
Figure 5
Figure 5
Expression of Ki67 in MC3T3E1 preosteoblasts cultured within porous hydrogel scaffolds under static or dynamic culture conditions. (A1A4): Individual cells in the exponential growth phase, fixed with 4% PFA before seeding ((A1): white light picture, (A2): Ki67 expression, (A3): cell nuclei, and (A4): merging of images (A2,A3)). (B1B4): Spheroids, formed spontaneously 5 h post-seeding (the image numbering, i.e., 1–4, has the same meaning as above). (C1C4,D1D4): The scaffolds were removed after 1 day of culture (d1). (E1E4,F1F4): The scaffolds were removed after 7 days (d7). (C1C4,E1E4): static cell culture. (D1D4,F1F4): dynamic cell culture. Cell nuclei were labeled DAPI (blue). The pictures were acquired by CLSM. The scale bars correspond to 100 μm.
Figure 6
Figure 6
Assessment of MC3T3E1 preosteoblast viability within porous hydrogel scaffolds under static or dynamic cell culture conditions. (A1A3): Viability was assessed after 1 day (d1) of static cell culture condition ((A1): green channel corresponding to the viability signal, (A2): red channel corresponding to the cell death signal, and (A3): merging of the two channels). (B1B3): Viability assessed after 1 day (d1) of dynamic cell culture condition (the image numbering, i.e., 1–3, has the same meaning as above). (C1C3): Viability assessed after 7 days (d7) of static cell culture condition. (D1D3): Viability assessed after 7 days (d7) of dynamic cell culture condition. (A1D3) are magnifications of representative spheroids with a 1.25 μm resolution. The white scale bars correspond to 100 μm.
Figure 7
Figure 7
Detection of spheroids and cell number quantification by MRI within porous hydrogel scaffolds. The porous hydrogel scaffolds were seeded with 0 (B1,C1), 100,000 (B2,C2), 300,000 (A1,B3,C3) and 600,000 (A2,B4,C4) cells that were pre-labelled with SPIONLA-HSA (20 μg[Fe] cm−2) and fixed with PFA 4% solution. (A1A3): Cell number was assessed by relaxometry using T2*-MSME sequences (250-μm thick slices with 55-μm resolution; 11 echo times (TE) with 13,845 ms spacing). The relaxometry curves were obtained after averaging the signal over the whole scaffolds (A1,A2) or for a target voxel (A3). Data points were fitted by Equation (S1) (Supplementary Information) according to Milford et al. [33]. R2 stands for the linear correlation coefficient. The seeded scaffolds were analyzed by MRI (T2-turbo-RARE sequence, 250-μm thick slice with 55-μm resolution). The grayscale images (B1B4) were segmented by image processing into four phases: air (black), liquid (white), hydrogel (green), and cells (red) (C1C4). A calibration curve ((D), dashed line, and white circle) is obtained by plotting the apparent cellular volume measured by MRI as a function of the number of seeded cells. The black square refers to the bioreactor with stacked hydrogels.
Figure 8
Figure 8
Measurement of the oxygen concentration in a well-stirred reactor to determine the oxygen diffusion coefficient within the hydrogel. (A): The oxygen concentration c (mg L−1) of the liquid phase in the well-stirred reactor was measured by an oxygen sensor as a function of time. N2-bubbling for 10 min allowed for degassing of the oxygen dissolved in the liquid phase (DPBS) until c=0.18 mg L−1 (“Degassing”). The well-stirred reactor was closed for 40 min until oxygen concentration stabilized at c1=0.90 mg L−1 (“Equilibrium”). The liquid phase was quickly renewed with oxygen-saturated DPBS until the maximal oxygen concentration c2=4.02 mg L−1. Then, the dissolved oxygen diffused from the liquid phase to the hydrogel for 50 min until the final oxygen concentration c=3.25 mg L−1 (“Diffusion”). (B): The diffusion coefficient D was deduced from the linear regression of the quantity lnc(t)c against the time t between t=840 s and t=1500 s. The origin of time t is indicated in (A) and corresponds to the beginning of the stepwise concentration variation from c1 to c2.
Figure 9
Figure 9
MRI acquisitions of a scaffold stack within a perfusion bioreactor. T2-turbo-RARE sequences were performed on slices of 250-μm thickness and 55-μm resolution. (A1A3): Bioreactor without cells: the grayscale images (A1) were segmented into the fluid (white) and the hydrogel scaffolds (green) (A2). The volume of interest (6.55 mm high) defined for the LBM simulations is delimited by red lines. The hydrogel scaffolds (green) of this volume were numerically seeded with spheroids (red dots) of 135 μm diameter (A3). The black scale bars stand for 4 mm. (B): Initial seeding was 100,000 cells per scaffold; the cells were pre-labeled with SPIONLA-HSA, 20 μg[Fe] cm−2. Cells were fixed with PFA 4% after culturing for 18 days in dynamic conditions (10 mL min−1). Cell volume estimation is reported on the calibration curve in Figure 7D. The scale bar stands for 4 mm.
Figure 10
Figure 10
LBM simulations of hydrodynamics and oxygen transport within a 6.55 mm high section of the perfusion bioreactor. The scaffold was numerically seeded with spheroids of 135 μm diameter (400,000 cells per scaffold). The fluid superficial velocity was 1.47 mm s−1 (q=10 mL min−1). The fluid (blue) had access to the porosity between the stacked hydrogel scaffolds (green). Fluid velocity was assumed to be zero in the hydrogel. Oxygen concentration in the fluid was set to c0=0.21 mol m−3. The oxygen diffusion coefficient inside the hydrogel scaffolds was D=1.6×10⁹ m2 s−1. Oxygen consumption by the cells was modeled by a Michaelis-Menten-like kinetics (Equation (8)). The xz cross-section (A1,B1) and the xy cross-section (A2,B2) intercept along the dashed red line. (A1): The vectors stand for the (vx,vz) components of the fluid velocities. (A2): The vectors stand for the (vx,vy) components of the fluid velocities. (B1,B2): The dissolved oxygen concentration in the fluid and the hydrogel is colored according to the linear heat scale.
Figure 11
Figure 11
LBM simulations of oxygen transport inside seeded hydrogel scaffolds. Four cases (AD) are reported with two different seedings, i.e., 900,000 cells per scaffold (A1,A2,C1,C2) and 100,000 cells per scaffold (B1,B2,D1,D2), and two spheroid diameters, i.e., 80 μm (A1,A2,B1,B2) and 400 μm (C1,C2,D1,D2). (A1D1): the oxygen concentration profile along the symmetry axis between two spheroid rows is plotted in red lines; the blue lines correspond to c=KM/2 and =0.5 Vmax/ϑ, i.e., the hypoxia limit. The green squares (A1,B1) represent the oxygen consumption rate at the spheroid center (expressed as a percentage of Vmax/ϑ), the green lines (C1,D1) the oxygen consumption rate along the spheroid diameter. (A2D2): oxygen concentration map in the scaffold median plane displayed in linear heat scale (A2,B2) or exponential heat scale (C2,D2). The black circles correspond to the spheroid outline.

Similar articles

Cited by

References

    1. Fennema E., Rivron N., Rouwkema J., van Blitterswijk C., de Boer J. Spheroid culture as a tool for creating 3D complex tissues. Trends Biotechnol. 2013;31:108–115. doi: 10.1016/j.tibtech.2012.12.003. - DOI - PubMed
    1. Hofer M., Lutolf M.P. Engineering organoids. Nat. Rev. Mater. 2021;6:402–420. doi: 10.1038/s41578-021-00279-y. - DOI - PMC - PubMed
    1. Griffith L.G., Swartz M.A. Capturing complex 3D tissue physiology in vitro. Nat. Rev. Mol. Cell Biol. 2006;7:211–224. doi: 10.1038/nrm1858. - DOI - PubMed
    1. Mammoto T., Ingber D.E. Mechanical control of tissue and organ development. Dev. Camb. Engl. 2010;137:1407–1420. doi: 10.1242/dev.024166. - DOI - PMC - PubMed
    1. Vianello S., Lutolf M.P. Understanding the Mechanobiology of Early Mammalian Development through Bioengineered Models. Dev. Cell. 2019;48:751–763. doi: 10.1016/j.devcel.2019.02.024. - DOI - PubMed

LinkOut - more resources