

Excitatory Dorsal Lateral Prefrontal Cortex Transcranial Magnetic Stimulation Increases Social Anxiety
- PMID: 37508921
- PMCID: PMC10377502
- DOI: 10.3390/brainsci13070989
Excitatory Dorsal Lateral Prefrontal Cortex Transcranial Magnetic Stimulation Increases Social Anxiety
Abstract
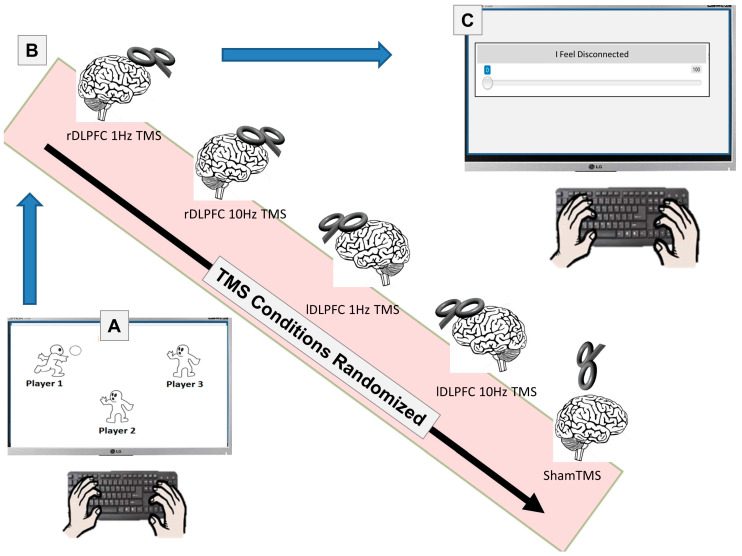
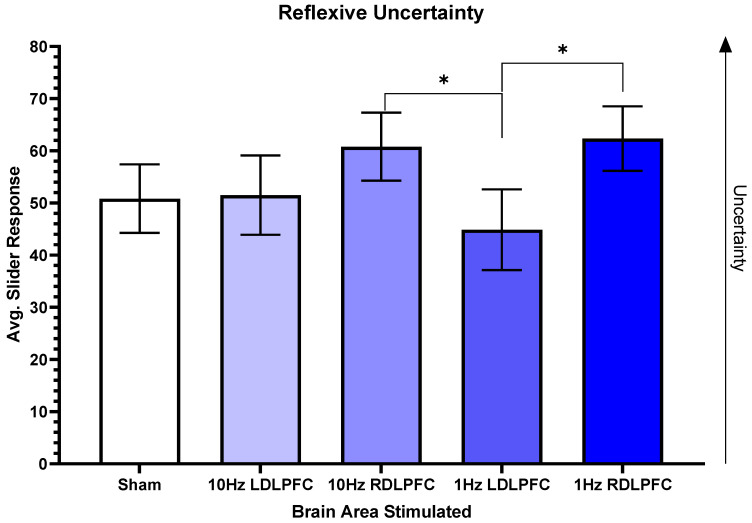
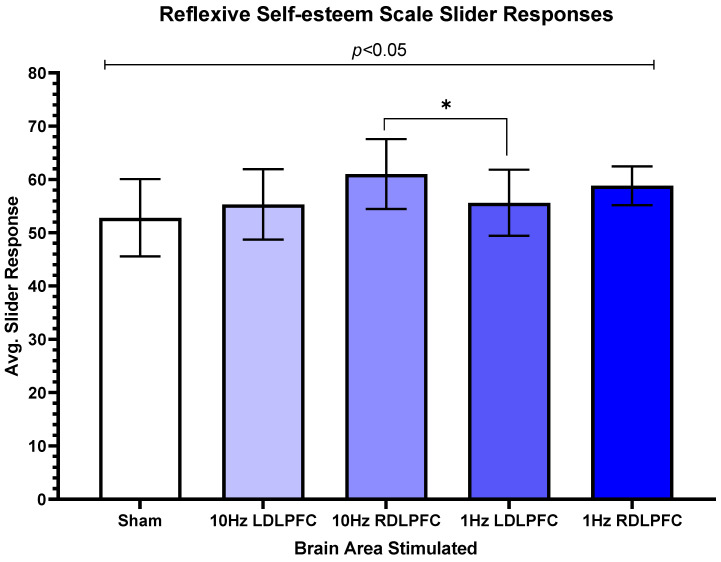
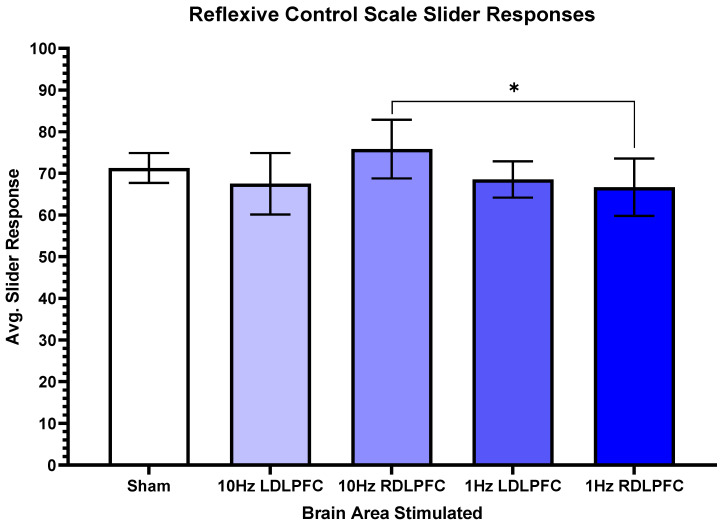
Social exclusion refers to the experience of rejection by one or more people during a social event and can induce pain-related sensations. Cyberball, a computer program, is one of the most common tools for analyzing social exclusion. Regions of the brain that underlie social pain include networks linked to the dorsal lateral prefrontal cortex (DLPFC). Specifically, self-directed negative socially induced exclusion is associated with changes in DLPFC activity. Direct manipulation of this area may provide a better understanding of how the DLPFC can influence the perception of social exclusion and determine a causal role of the DLPFC. Transcranial magnetic stimulation (TMS) was applied to both the left and right DLPFC to gauge different reactions to the Cyberball experience. It was found that there were elevated exclusion indices following right DLPFC rTMS; participants consistently felt more excluded when the right DLPFC was excited. This may relate to greater feelings of social pain when the right DLPFC is manipulated. These data demonstrate that direct manipulation of the DLPFC results in changes in responses to social exclusion.
Keywords: Cyberball; DLPFC; TMS; pain; rTMS; social exclusion; social pain.
Conflict of interest statement
The authors declare no conflict of interest.
Figures
Similar articles
-
The VLPFC versus the DLPFC in Downregulating Social Pain Using Reappraisal and Distraction Strategies.J Neurosci. 2021 Feb 10;41(6):1331-1339. doi: 10.1523/JNEUROSCI.1906-20.2020. Epub 2020 Dec 21. J Neurosci. 2021. PMID: 33443069 Free PMC article.
-
Low-frequency brain stimulation to the left dorsolateral prefrontal cortex increases the negative impact of social exclusion among those high in personal distress.Soc Neurosci. 2017 Jun;12(3):237-241. doi: 10.1080/17470919.2016.1166154. Epub 2016 Mar 28. Soc Neurosci. 2017. PMID: 27020950
-
Modulating Emotion Perception: Opposing Effects of Inhibitory and Excitatory Prefrontal Cortex Stimulation.Biol Psychiatry Cogn Neurosci Neuroimaging. 2018 Apr;3(4):329-336. doi: 10.1016/j.bpsc.2017.12.007. Epub 2017 Dec 29. Biol Psychiatry Cogn Neurosci Neuroimaging. 2018. PMID: 29628065
-
[Therapeutic application of repetitive transcranial magnetic stimulation for major depression].Seishin Shinkeigaku Zasshi. 2012;114(11):1231-49. Seishin Shinkeigaku Zasshi. 2012. PMID: 23367835 Review. Japanese.
-
Evidence-based guidelines on the therapeutic use of repetitive transcranial magnetic stimulation (rTMS): An update (2014-2018).Clin Neurophysiol. 2020 Feb;131(2):474-528. doi: 10.1016/j.clinph.2019.11.002. Epub 2020 Jan 1. Clin Neurophysiol. 2020. PMID: 31901449 Review.
Cited by
-
Consistently increased dorsolateral prefrontal cortex activity during the exposure to acute stressors.Cereb Cortex. 2024 Apr 1;34(4):bhae159. doi: 10.1093/cercor/bhae159. Cereb Cortex. 2024. PMID: 38642105 Free PMC article.
-
The Neural Correlates of Narcissism: Is There a Connection with Desire for Fame and Celebrity Worship?Brain Sci. 2023 Oct 23;13(10):1499. doi: 10.3390/brainsci13101499. Brain Sci. 2023. PMID: 37891865 Free PMC article. Review.
-
Beyond Pharmacology: A Narrative Review of Alternative Therapies for Anxiety Disorders.Diseases. 2024 Sep 16;12(9):216. doi: 10.3390/diseases12090216. Diseases. 2024. PMID: 39329885 Free PMC article. Review.
References
-
- Riva P., Eck J. Social Exclusion: Psychological Approaches to Understanding and Reducing Its Impact. Volume 26 Springer; Cham, Switzerland: 2016. The many faces of social exclusion.
LinkOut - more resources
Full Text Sources
