. 2023 Jul 18;15(14):3661.
doi: 10.3390/cancers15143661.

Decreased Gene Expression of Antiangiogenic Factors in Endometrial Cancer: qPCR Analysis and Machine Learning Modelling

Affiliations

Decreased Gene Expression of Antiangiogenic Factors in Endometrial Cancer: qPCR Analysis and Machine Learning Modelling

Luka Roškar et al. Cancers (Basel). .

Abstract

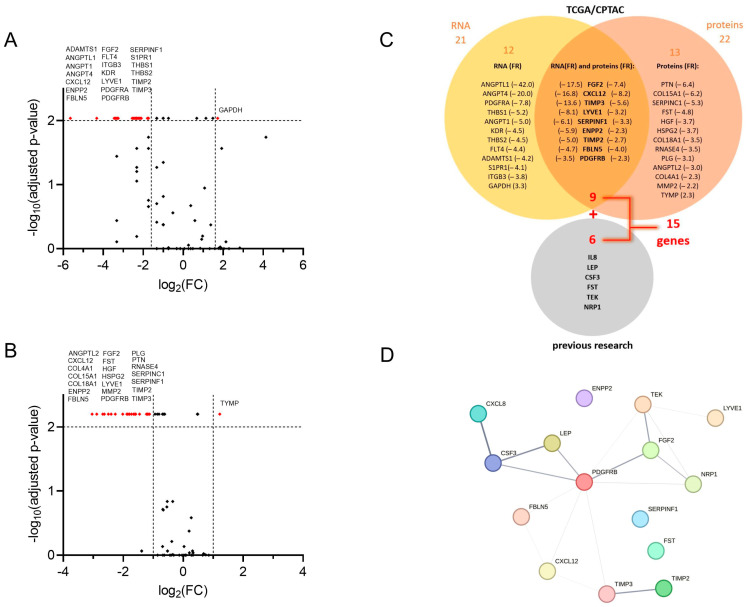
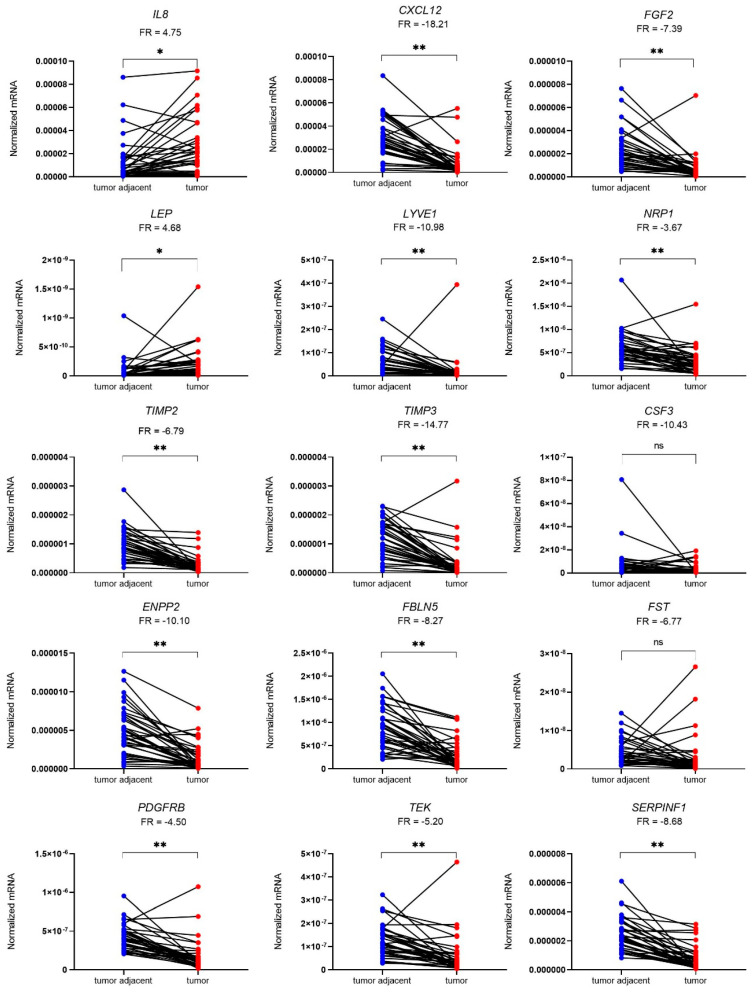
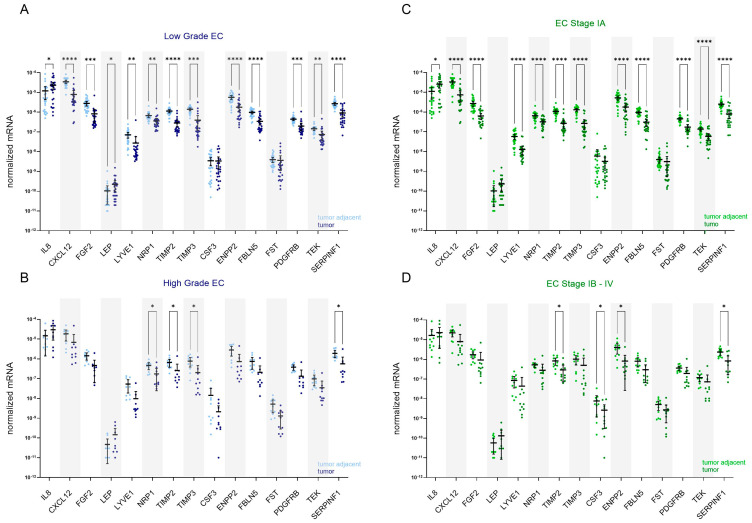
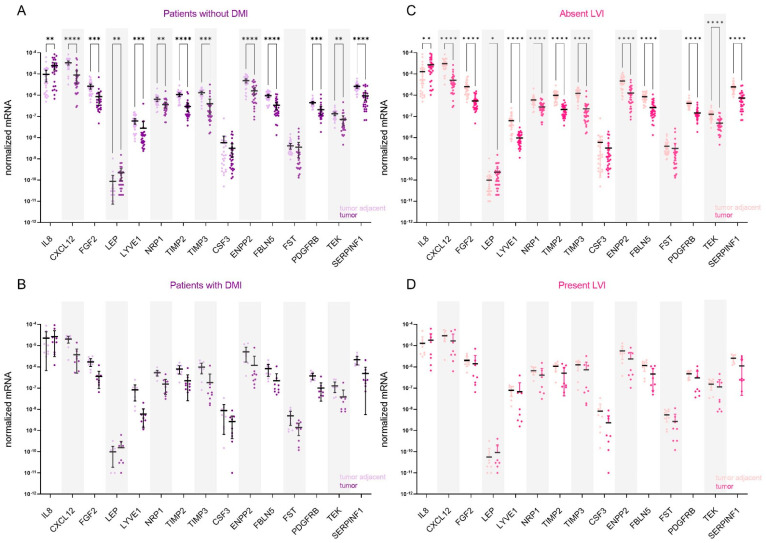
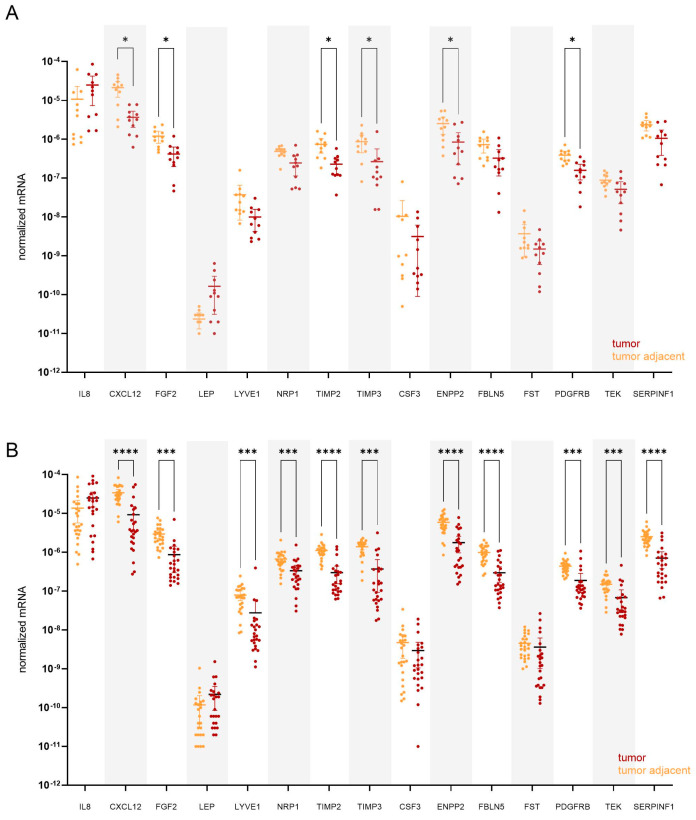
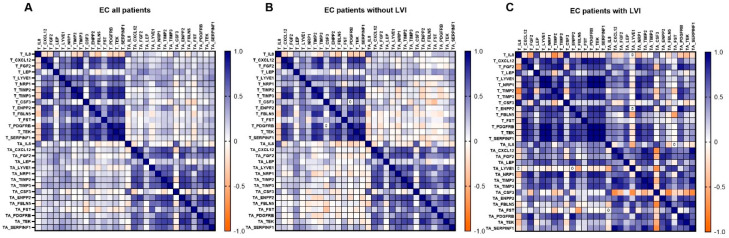
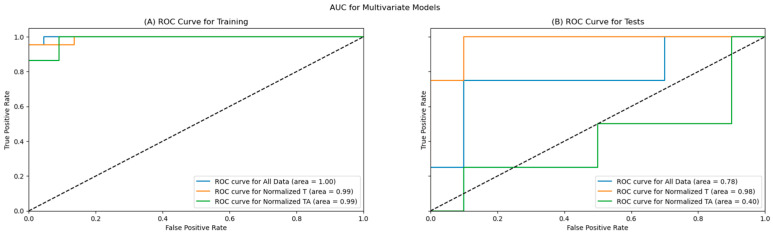
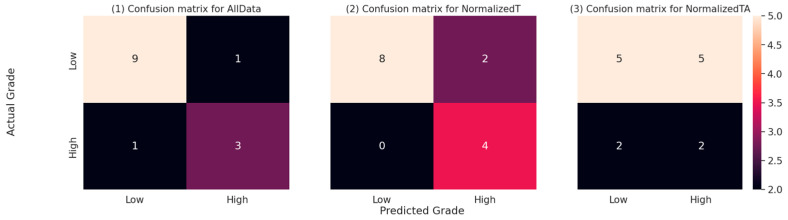
Endometrial cancer (EC) is an increasing health concern, with its growth driven by an angiogenic switch that occurs early in cancer development. Our study used publicly available datasets to examine the expression of angiogenesis-related genes and proteins in EC tissues, and compared them with adjacent control tissues. We identified nine genes with significant differential expression and selected six additional antiangiogenic genes from prior research for validation on EC tissue in a cohort of 36 EC patients. Using machine learning, we built a prognostic model for EC, combining our data with The Cancer Genome Atlas (TCGA). Our results revealed a significant up-regulation of IL8 and LEP and down-regulation of eleven other genes in EC tissues. These genes showed differential expression in the early stages and lower grades of EC, and in patients without deep myometrial or lymphovascular invasion. Gene co-expressions were stronger in EC tissues, particularly those with lymphovascular invasion. We also found more extensive angiogenesis-related gene involvement in postmenopausal women. In conclusion, our findings suggest that angiogenesis in EC is predominantly driven by decreased antiangiogenic factor expression, particularly in EC with less favourable prognostic features. Our machine learning model effectively stratified EC based on gene expression, distinguishing between low and high-grade cases.

Keywords: LEP; TCGA; angiogenic factor; endometrial cancer; machine learning; tumour-adjacent tissue.


Conflict of interest statement

The authors declare no conflict of interest.

Figures

Figure 1
Figure 1
Selection of angiogenesis-related genes in the study. Volcano plot visualising fold change (FC) and the corresponding p-values of (A) normalised mRNA (data are from the GDC TCGA Endometrioid Cancer (UCEC) study, downloaded from UCSC Xena server [21]). Paired samples, n = up to 23; Wilcoxon matched-pairs signed rank test with Bonferroni–Šidák corrections for multiple comparisons, and (B) angiogenesis-associated proteins in tumour tissue versus control tissue (data are from the CPTAC UCEC Discovery Study—Proteome, PDC ID: PDC000125 [22]. Paired samples, n = up to 24; Wilcoxon matched-pairs signed rank test with Bonferroni–Šidák corrections for multiple comparisons. Vertical lines: log2FC cut-off values in a selection protocol; red dots: genes/proteins that reach more than 2- or 3-fold significant difference with adjusted p < 0.01 as a criterion for further evaluation. (C) Venn-diagram of a selection process, and 21 genes with more than 3-fold expression change in tumour versus adjacent tissue, and 22 proteins with more than 2-fold level change in tumour versus adjacent tissue. Nine proteins and their encoding genes fulfilled both criteria simultaneously and were chosen for further validation using a clinical cohort. Genes encoding six proteins from our previous research [14,18] were added, leading to further analysis of 15 genes. (D) Analysis of protein–protein interactions from the STRING database for association networks [33]. Several known (from curated databases) and predicted interactions (based on gene co-occurrence, co-expression, and gene homology) are shown; the line thickness indicates the strength of data support.
Figure 2
Figure 2
Expression of genes encoding 15 angiogenic factors in 36 paired samples of EC (T) and tumour-adjacent (TA) tissue. Data were analysed using the Wilcoxon matched-pairs signed rank test with Bonferroni–Šidák corrections for multiple comparisons. Fold regulation (FR) is presented as a mean of pairwise T/TA expression ratios or their negative inverse values. * p-value ≤ 0.05, ** p-value ≤ 0.01, ns—not significant.
Figure 3
Figure 3
Expression of angiogenesis-related genes in EC patients stratified based on the cancer grade and stage. Expression of genes encoding 15 angiogenic factors in paired tissue samples from patients with (A) low-grade EC (n = 26) and (B) high-grade EC (n = 10); tumour tissue is shown in dark blue and tumour-adjacent tissue in light blue colour. Expression of genes in paired tissue samples from (C) patients with stage IA EC (n = 25) and (D) stage IB–IV EC (n = 11); tumour tissue is shown in dark green, and tumour-adjacent tissue is in light green colour. Wilcoxon matched pairs signed rank tests with Bonferroni–Šidák corrections for multiple comparisons. Data are shown as scattered dot plots with marked means with 95% CI, * p-value ≤ 0.05, ** p-value ≤ 0.01, *** p-value ≤ 0.001, **** p-value ≤ 0.0001.
Figure 4
Figure 4
Expression of angiogenesis-related genes in EC patients stratified based on the presence of deep myometrial (DMI) or lymphovascular invasion (LVI). Expression of genes encoding 15 angiogenic factors in paired tissue samples from (A) patients without DMI (n = 27) and (B) from patients with present DMI (n = 9); tumour tissue is shown in dark purple and tumour-adjacent tissue in light purple colour. Expression of genes in paired tissue samples from (C) patients without LVI (n = 28) and (D) from patients with present LVI (n = 8). Tumour tissue is shown in dark pink, and the adjacent tissue is in light pink. Wilcoxon matched pairs signed rank tests with Bonferroni–Šidák corrections for multiple comparisons. Data are shown as scattered dot plots with marked means with 95% CI, * p-value ≤ 0.05, ** p-value ≤ 0.01, *** p-value ≤ 0.001, **** p-value ≤ 0.0001.
Figure 5
Figure 5
Expression of angiogenesis-related genes in paired tissue samples from (A) premenopausal (n = 11) and from (B) postmenopausal EC patients (n = 25). Tumour tissue is shown in dark red, and tumour-adjacent tissue is in orange colour. Wilcoxon matched pairs signed rank tests with Bonferroni–Šidák corrections for multiple comparisons. Data are shown as scattered dot plots with marked means with 95% CI, * p-value ≤ 0.05, *** p-value ≤ 0.001, **** p-value ≤ 0.0001.
Figure 6
Figure 6
Gene co-expression pattern in tumour tissue, tumour-adjacent tissue, and between both of them. (A) All EC patients; n = 36, (B) EC patients without LVI; n = 28, (C) EC patients with LVI; n = 8. A Heatmap of Spearman correlation coefficients is shown. For details on strong correlations, see Table 5.
Figure 7
Figure 7
ROC Curves for the training (A) and test (B) datasets.
Figure 8
Figure 8
Confusion matrices for all three models on the test dataset. The numbers represent the number of predictions falling into each of the combinations of actual (real) EC tumour grade and the EC tumour grade predicted by the respective model. The cell colours represent the relative numbers, with darker colours representing lower counts and lighter colours representing higher counts.

Similar articles

References

    1. Crosbie E.J., Kitson S.J., McAlpine J.N., Mukhopadhyay A., Powell M.E., Singh N. Endometrial cancer. Lancet. 2022;399:1412–1428. doi: 10.1016/S0140-6736(22)00323-3. - DOI - PubMed
    1. Zhang S., Gong T.T., Liu F.H., Jiang Y.T., Sun H., Ma X.X., Zhao Y.H., Wu Q.J. Global, Regional, and National Burden of Endometrial Cancer, 1990–2017: Results from the Global Burden of Disease Study, 2017. Front. Oncol. 2019;9:1440. doi: 10.3389/fonc.2019.01440. - DOI - PMC - PubMed
    1. Lee N.K., Cheung M.K., Shin J.Y., Husain A., Teng N.N., Berek J.S., Kapp D.S., Osann K., Chan J.K. Prognostic factors for uterine cancer in reproductive-aged women. Obstet. Gynecol. 2007;109:655–662. doi: 10.1097/01.AOG.0000255980.88205.15. - DOI - PubMed
    1. Wilczyński M., Danielska J., Wilczyński J. An update of the classical Bokhman’s dualistic model of endometrial cancer. Przegląd Menopauzalny. 2016;15:63–68. doi: 10.5114/pm.2016.61186. - DOI - PMC - PubMed
    1. Murali R., Soslow R.A., Weigelt B. Classification of endometrial carcinoma: More than two types. Lancet Oncol. 2014;15:e268–e278. doi: 10.1016/S1470-2045(13)70591-6. - DOI - PubMed

LinkOut - more resources