. 2023 Jun 22;11(7):1790.
doi: 10.3390/biomedicines11071790.

Hydrogen Sulfide Ameliorates SARS-CoV-2-Associated Lung Endothelial Barrier Disruption

Affiliations

Hydrogen Sulfide Ameliorates SARS-CoV-2-Associated Lung Endothelial Barrier Disruption

Olivier Escaffre et al. Biomedicines. .

Abstract

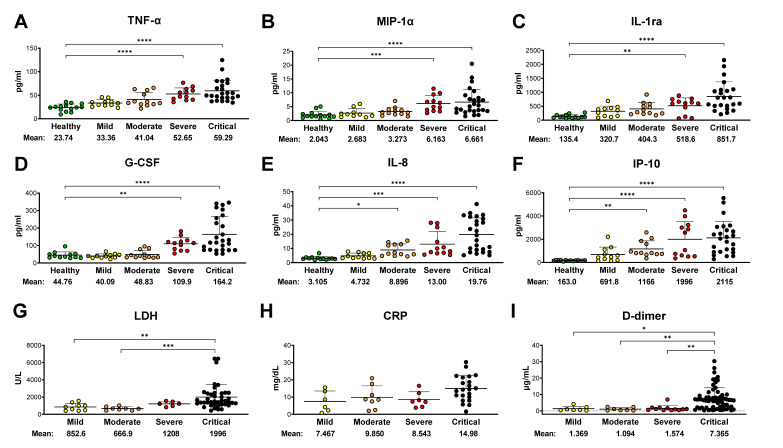
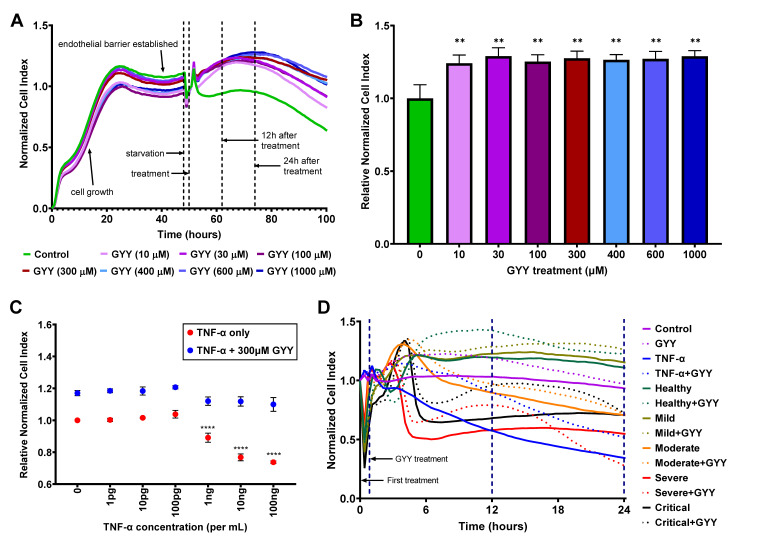
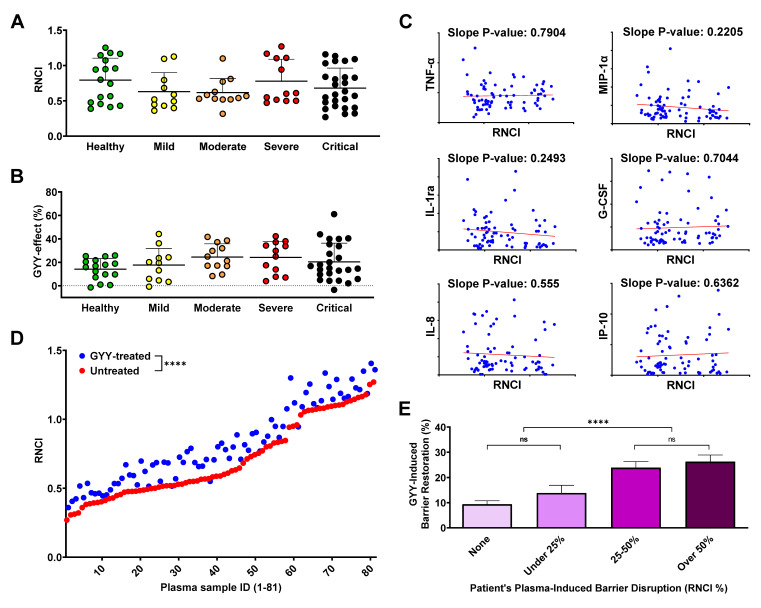
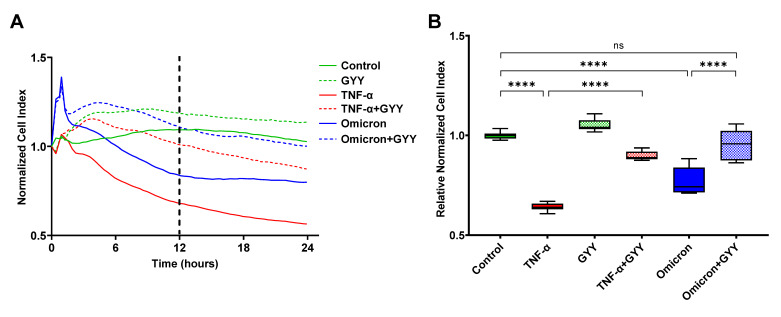
Recent studies have confirmed that lung microvascular endothelial injury plays a critical role in the pathophysiology of COVID-19. Our group and others have demonstrated the beneficial effects of H2S in several pathological processes and provided a rationale for considering the therapeutic implications of H2S in COVID-19 therapy. Here, we evaluated the effect of the slow-releasing H2S donor, GYY4137, on the barrier function of a lung endothelial cell monolayer in vitro, after challenging the cells with plasma samples from COVID-19 patients or inactivated SARS-CoV-2 virus. We also assessed how the cytokine/chemokine profile of patients' plasma, endothelial barrier permeability, and disease severity correlated with each other. Alterations in barrier permeability after treatments with patient plasma, inactivated virus, and GYY4137 were monitored and assessed by electrical impedance measurements in real time. We present evidence that GYY4137 treatment reduced endothelial barrier permeability after plasma challenge and completely reversed the endothelial barrier disruption caused by inactivated SARS-CoV-2 virus. We also showed that disease severity correlated with the cytokine/chemokine profile of the plasma but not with barrier permeability changes in our assay. Overall, these data demonstrate that treatment with H2S-releasing compounds has the potential to ameliorate SARS-CoV-2-associated lung endothelial barrier disruption.

Keywords: COVID-19; SARS-CoV-2; TNF-α; cytokine; endothelial barrier; hydrogen sulfide.


Conflict of interest statement

The authors declare no conflict of interest.

Figures

Figure 1
Figure 1
Disease severity positively correlates with plasma cytokine profiles and routine laboratory data. (AF) Cytokine levels in plasma samples from COVID-19 patients and healthy volunteers were measured using Bio-Plex Pro Human Cytokine 27-plex Assay (Bio-Rad) and plotted grouped by disease severity. Only the statistical differences compared to the healthy control group are highlighted in these panels; (GI) clinical laboratory marker measurements (all available longitudinal data; normal reference range: LDH < 280 U/L; CRP < 1 mg/dL; D-dimer < 0.5 µg/mL) of the same patient cohort were plotted grouped by disease severity. All statistical differences found between patient groups are labeled. All results in this figure are presented as dot plots of individual mean values for each sample. Bars represent group means and standard deviations. The statistical significance was assessed by Kruskal–Wallis non-parametric one-way ANOVA test followed by Dunn’s multiple comparisons. *, p < 0.05; **, p < 0.01; ***, p < 0.001; ****, p < 0.0001.
Figure 2
Figure 2
Exogenous H2S released by GYY4137 increases endothelial barrier function. HLMVECs were seeded on E-plates and incubated in growth medium for 48 h to form a confluent monolayer, then starved for 2 h before treatment. The effects of biomolecules and patient plasma treatment on the barrier function were monitored by electrical impedance measurements (Cell Index) using the xCELLigence Real-Time Cell Analysis system. Higher Cell Index, as well as Normalized and Relative Normalized Cell Index (described in Materials and Methods) values, represent increased barrier function. (A,B) GYY4137 treatment alone raises barrier function in all tested concentrations. Representative ribbon plots (mean of 3–6 replicates of each condition) of different GYY4137 concentrations (A) and histogram (mean ± SD, n = 3–9) of normalized data 12 h after treatment (B) are presented. Statistical differences for each GYY4137 concentration compared to control at 12 h are labeled. (C) GYY4137 treatment attenuates TNF-α–induced endothelial barrier disruption. Data are shown as mean ± SD of 3–6 measurements 12 h after treatment. Point 0 (zero control) red dot indicates no treatment, blue dot indicates GYY4137 treatment alone. Statistical differences compared to corresponding zero control are labeled. (D) GYY4137 enhances endothelial barrier function at 12 h after treatment with plasma samples. Ribbon plots show all measurements (as mean of 3–6 replicates of a single sample of each group) for 24 h after the first treatment. Thirty-minute, 12 h, and 24 h time points are marked by blue, dashed vertical lines. The statistical significance was assessed by (B) non-parametric Mann–Whitney U tests or (C) two-way ANOVA, followed by Tukey’s multiple comparisons test. **, p < 0.01; ****, p < 0.0001; GYY, GYY4137.
Figure 3
Figure 3
GYY4137 treatment ameliorates endothelial barrier disruption regardless of disease status. (A,B) Barrier function of an HLMVEC monolayer after treatment with COVID-19 or healthy plasma samples and a second treatment using 300 µM GYY4137 was monitored by electrical impedance measurements using the xCELLigence Real-Time Cell Analysis system. Results are expressed as Relative Normalized Cell Index (RNCI, described in Materials and Methods). Data were collected from at least three independent experiments for each sample (n = 3–6). RNCI values of HLMVEC monolayer after 12 h incubation with healthy or COVID-19 plasma samples (A) and the effect of GYY4137 on the RNCI of the plasma-treated HLMVEC monolayer at 12 h (B) were plotted by disease severity. Data are presented as dot plots of mean values from 3–6 repeated measurements of each sample. Bars represent group means and standard deviations. No statistical differences among disease severity groups were found. (C) Cytokine levels in the plasma samples used for barrier function experiments were measured using Bio-Plex Pro Human Cytokine 27-plex Assay (Bio-Rad) and plotted against the corresponding RNCI values at 12 h in scatterplots. Slope p-values were calculated to determine statistically significant levels of correlation. None were found. (D) Treatment efficacy plot showing RNCI of HLMVEC monolayer after plasma treatment with or without the addition of GYY4137. Dots represent means of 3–6 measurements for each treatment obtained at the 12 h timepoint. Statistical difference between RNCI values of untreated and GYY-treated samples is shown. (E) The effect of GYY4137 treatment for each plasma sample was plotted grouped by the level of plasma-induced barrier disruption. Bars represent group means + SD of all measurements (3–6 measurements per sample) 12 h after treatment. Selected statistical differences among groups are labeled. The statistical significance was assessed by Kruskal–Wallis non-parametric one-way ANOVA test followed by Dunn’s multiple comparisons (A,B), simple linear regression (C), 2-tailed, non-parametric, Wilcoxon matched-pairs signed rank t-test (D), and one-way ANOVA followed by Tukey’s multiple comparisons test (E). ****, p < 0.0001; ns, p > 0.05; GYY, GYY4137.
Figure 4
Figure 4
GYY4137 treatment restores endothelial barrier integrity disrupted by inactivated SARS-CoV-2 Omicron BA.1. Barrier function of an HLMVEC monolayer after treatment with inactivated SARS-CoV-2 or 10 ng/mL TNF-α and a second treatment with 300 µM GYY4137 was monitored by electrical impedance measurements using the xCELLigence Real-Time Cell Analysis system and expressed as Normalized Cell Index and Relative Normalized Cell Index (NCI and RNCI, respectively, described in Materials and Methods). Representative plots of three independent experiments are shown. (A) Ribbon plots show all NCI measurements (as mean of 6–12 replicates) for 24 h after the first treatment. The 12 h time point is marked by dashed vertical line. (B) Box and whiskers plots represent RNCI data 12 h after treatment (6–12 replicates per treatment). The box extends from the 25th to 75th percentiles of each sample set, the whiskers go down to the smallest value and up to the largest. The line in the middle of the box is plotted at the median. Selected statistical differences among treatments are labeled. The statistical significance was assessed by one-way ANOVA followed by Tukey’s multiple comparisons test using Graph Pad Prism 9. ****, p < 0.0001; ns, p > 0.05; GYY, GYY4137; Omicron, SARS-CoV-2 Omicron B.1.1.529.

Similar articles

Cited by

References

    1. World Health Organization (WHO) Coronavirus (COVID-19) Dashboard. [(accessed on 18 May 2023)]. Available online: https://covid19.who.int.
    1. Gebo K.A., Heath S.L., Fukuta Y., Zhu X., Baksh S., Abraham A.G., Habtehyimer F., Shade D., Ruff J., Ram M., et al. Early Treatment, Inflammation and Post-COVID Conditions. medRxiv. 2023 doi: 10.1101/2023.02.13.23285855. - DOI - PMC - PubMed
    1. Phillips S., Williams M.A. Confronting Our Next National Health Disaster—Long-Haul Covid. N. Engl. J. Med. 2021;385:577–579. doi: 10.1056/NEJMp2109285. - DOI - PubMed
    1. Center for Disease Control and Prevention (CDC), Long COVID or Post-COVID Conditions. [(accessed on 18 May 2023)]; Available online: https://www.cdc.gov/coronavirus/2019-ncov/long-term-effects/index.html.
    1. Ahamed J., Laurence J. Long COVID endotheliopathy: Hypothesized mechanisms and potential therapeutic approaches. J. Clin. Investig. 2022;132:e161167. doi: 10.1172/JCI161167. - DOI - PMC - PubMed

LinkOut - more resources