

Adjuvant Effect of Whole-Cell Pertussis Component on Tetanus Toxoid Potency in Murine Model
- PMID: 37509435
- PMCID: PMC10376220
- DOI: 10.3390/biomedicines11071795
Adjuvant Effect of Whole-Cell Pertussis Component on Tetanus Toxoid Potency in Murine Model
Abstract
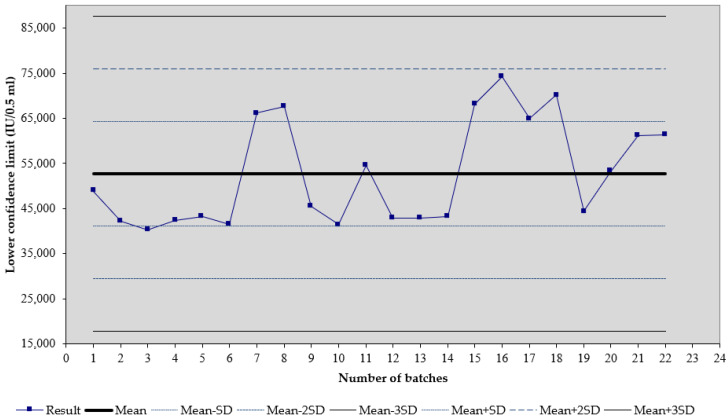
There is currently an increasing interest in the development of new-generation purified antigen-based vaccines with a higher safety profile compared to conventional inactivated vaccines. The main problem of subunit vaccines is their lower immunogenicity compared to whole-cell vaccines and inducing weaker and shorter-lasting immune responses. In this paper, the results of the assay of the potency of the tetanus component combined with the diphtheria component and whole-cell pertussis vaccine (DTwP), diphtheria and tetanus vaccine (DT), and in monovalent tetanus vaccine (T) are presented. In the mice model, an adjuvant impact of the whole-cell pertussis component on the immune response against tetanus was observed. It was noticed that the potency of tetanus component in the DTwP vaccine was significantly higher than tetanus potency in DT and T vaccines, despite the same bounding ability unit of the tetanus toxoid in the vaccine formulations. The levels of induction of tetanus antibodies by the tested vaccines were also examined. There were no differences in the induction of humoral responses against tetanus by tested vaccines. This publication discusses the possible mechanisms of impact of the whole-cell pertussis component on the other vaccine antigens and the positive and negative aspects of using the whole-cell pertussis component as an adjuvant.
Keywords: adjuvant; control laboratory; diphtheria; pertussis; tetanus; vaccines.
Conflict of interest statement
The authors declare no conflict of interest.
Figures


Similar articles
-
The effect of reconstitution of an Haemophilus influenzae type b-tentanus toxoid conjugate (PRP-T) vaccine on the immune responses to a diphtheria-tetanus-whole cell pertussis (DTwP) vaccine: a five-year follow-up.Vaccine. 1999 Jun 4;17(20-21):2588-98. doi: 10.1016/s0264-410x(99)00047-x. Vaccine. 1999. PMID: 10418907 Clinical Trial.
-
A cellular pertussis vaccine (Infanrix-DTPa; SB-3). A review of its immunogenicity, protective efficacy and tolerability in the prevention of Bordetella pertussis infection.Drugs. 1996 Aug;52(2):254-75. doi: 10.2165/00003495-199652020-00010. Drugs. 1996. PMID: 8841742 Review.
-
Diphtheria-tetanus-acellular pertussis vaccine adsorbed (Triacelluvax; DTaP3-CB): a review of its use in the prevention of Bordetella pertussis infection.Paediatr Drugs. 2000 Mar-Apr;2(2):139-59. doi: 10.2165/00148581-200002020-00007. Paediatr Drugs. 2000. PMID: 10937466 Review.
-
Comparison of a three-component acellular pertussis vaccine with a whole-cell pertussis vaccine in 15- through 20-month-old infants.Pediatrics. 1994 Apr;93(4):656-9. Pediatrics. 1994. PMID: 8134224 Clinical Trial.
-
A safety and immunogenicity comparison of 12 acellular pertussis vaccines and one whole-cell pertussis vaccine given as a fourth dose in 15- to 20-month-old children.Pediatrics. 1997 Nov;100(5):772-88. doi: 10.1542/peds.100.5.772. Pediatrics. 1997. PMID: 9346976 Clinical Trial.
Cited by
-
BECC438b TLR4 agonist supports unique immune response profiles from nasal and muscular DTaP pertussis vaccines in murine challenge models.Infect Immun. 2024 Mar 12;92(3):e0022323. doi: 10.1128/iai.00223-23. Epub 2024 Feb 7. Infect Immun. 2024. PMID: 38323817 Free PMC article.
References
-
- Prygiel M., Mosiej E., Górska P., Zasada A.A. Diphtheria-tetanus-pertussis vaccine: Past, current & future. Future Microbiol. 2022;17:185–197. - PubMed
-
- Plotkin S.A., Orenstein W.A., Offit P.A. Plotkin’s Vaccines. 7th ed. Elsevier; Philadelphia, PA, USA: 2017. pp. 711–761.
-
- Greenberg L., Fleming D.S. The immunizing efficiency of diphtheria toxoid when combined with various antigens. Can. J. Public Health. 1948;39:131–135. - PubMed
Grants and funding
LinkOut - more resources
Full Text Sources
