. 2023 Jun 26;11(7):1827.
doi: 10.3390/biomedicines11071827.

Anti-PD-1 Monoclonal Antibodies (mAbs) Are Superior to Anti-PD-L1 mAbs When Combined with Chemotherapy in First-Line Treatment for Metastatic Non-Small Cell Lung Cancer (mNSCLC): A Network Meta-Analysis

Affiliations

Anti-PD-1 Monoclonal Antibodies (mAbs) Are Superior to Anti-PD-L1 mAbs When Combined with Chemotherapy in First-Line Treatment for Metastatic Non-Small Cell Lung Cancer (mNSCLC): A Network Meta-Analysis

Joe Q Wei et al. Biomedicines. .

Abstract

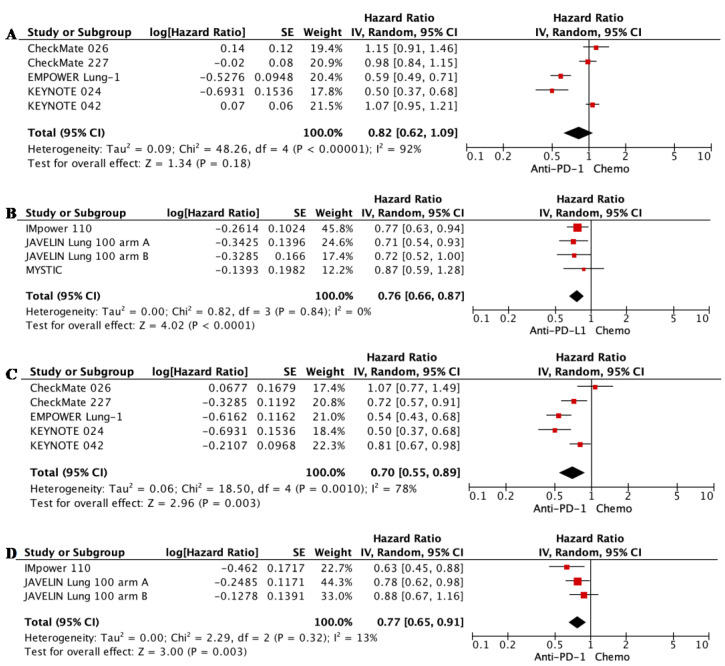
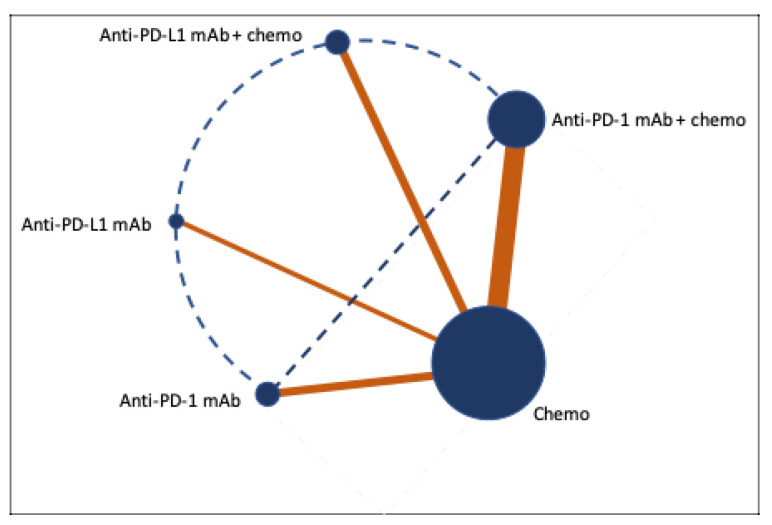
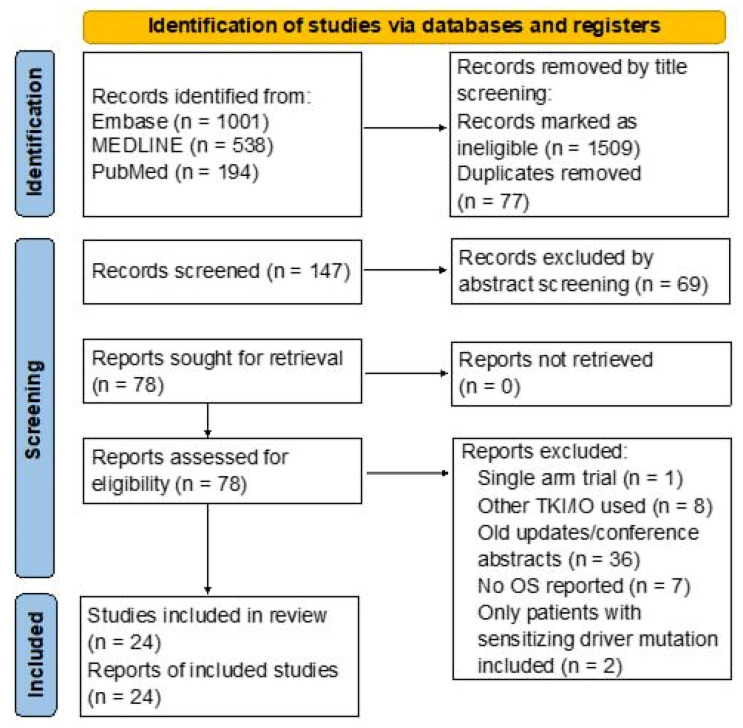
Platinum-based chemotherapy combined with anti-PD-1 or PD-L1 monoclonal antibodies (mAbs) is now standard first-line therapy for mNSCLC patients without sensitizing driver mutations. Anti-PD-1 and anti-PD-L1 mAbs are considered to be equivalent in efficacy. In the absence of head-to-head randomized control trials (RCTs), we utilized network meta-analysis (NWM) to provide an indirect comparison of their efficacy. A systematic literature review and NWM were performed using RCTs that investigated anti-PD-1 or PD-L1 mAbs ± chemotherapy in patients with mNSCLC in the first-line setting. The primary outcome was comparative overall survival (OS), while secondary outcomes were comparative progression-free survival (PFS), objective response rate (ORR), and rate of grade 3 and higher toxicities. We identified 24 RCTs. Patients treated with anti-PD-1 mAb + chemotherapy compared with anti-PD-L1 mAb + chemotherapy showed superior mOS, mPFS, and ORR with a similar rate of grade 3 and higher toxicities. This difference in mOS was most pronounced in the PD-L1 TPS 1-49% population. The two mAbs were equivalent as single agents. Anti-PD-1 mAb + chemotherapy improved mOS when compared to anti-PD-1 mAb monotherapy, whereas anti-PD-L1 mAbs + chemotherapy did not when compared to anti-PD-L1 mAb monotherapy. Head-to-head RCTs are warranted in the future.

Keywords: anti-PD-1; anti-PD-L1; chemoimmunotherapy; immunotherapy; non-small cell lung cancer.


Conflict of interest statement

The authors declare no conflict of interest.

Figures

Figure A1
Figure A1
Risk of bias analysis for studies included in the network meta-analyses. D1, risk of bias arising from the randomization process; D2, risk of bias owing to deviations from the intended interventions; D3, risk of bias from missing outcome data; D4, risk of bias in the measurement of the outcome; D5, risk of bias in the selection of the reported result.
Figure A2
Figure A2
Forest plot for meta-analyses of median overall survival (mOS). (A) anti-PD-1 mAb monotherapy versus chemotherapy alone for patients with PD-L1 TPS >1%; (B) anti-PD-L1 mAb monotherapy versus chemotherapy alone for patients with PD-L1 TPS >1%.
Figure A3
Figure A3
Forest plot for meta-analyses of median progression-free survival (mPFS) for immunotherapy alone. (A) anti-PD-1 mAb monotherapy versus chemotherapy alone in patients with PD-L1 TPS >1%; (B) anti-PD-L1 mAb monotherapy versus chemotherapy alone in patients with PD-L1 TPS >1%; (C) anti-PD-1 mAb monotherapy versus chemotherapy alone in patients with PD-L1 TPS > 50%; (D) anti-PD-L1 mAb monotherapy versus chemotherapy alone in patients with PD-L1 TPS > 50%.
Figure A4
Figure A4
Forest plot for meta-analyses of objective response rate (ORR) for immunotherapy alone. (A) anti-PD-1 mAb monotherapy versus chemotherapy alone in patients with PD-L1 TPS >1%; (B) anti-PD-L1 mAb monotherapy versus chemotherapy alone in patients with PD-L1 TPS >1%.
Figure A5
Figure A5
Forest plot for meta-analyses of median overall survival (mOS) according to histology type. (A) anti-PD-1 mAb + chemotherapy versus chemotherapy alone for patients with squamous NSCLC; (B) anti-PD-L1 mAb + chemotherapy versus chemotherapy alone for patients with squamous NSCLC; (C) anti-PD-1 mAb + chemotherapy versus chemotherapy alone for patients with non-squamous NSCLC; (D) anti-PD-L1 mAb + chemotherapy versus chemotherapy alone for patients with non-squamous NSCLC.
Figure A6
Figure A6
Forest plot for meta-analyses of median overall survival (mOS) according to PD-L1 TPS. (A) anti-PD-1 mAb + chemotherapy versus chemotherapy alone for patients with PD-L1 TPS < 1%; (B) anti-PD-L1 mAb + chemotherapy versus chemotherapy alone for patients with PD-L1 TPS < 1%; (C) anti-PD-1 mAb + chemotherapy versus chemotherapy alone for patients with PD-L1 TPS 1–49%; (D) anti-PD-L1 mAb + chemotherapy versus chemotherapy alone for patients with PD-L1 TPS 1-49%; (E) anti-PD-1 mAb + chemotherapy versus chemotherapy alone for patients with PD-L1 TPS > 50%; (F) anti-PD-L1 mAb + chemotherapy versus chemotherapy alone for patients with PD-L1 TPS > 50%.
Figure A7
Figure A7
Forest plot for meta-analyses of progression-free survival (PFS) according to PD-L1 TPS. (A) anti-PD-1 mAb + chemotherapy versus chemotherapy alone for patients with PD-L1 TPS < 1%; (B) anti-PD-L1 mAb + chemotherapy versus chemotherapy alone for patients with PD-L1 TPS < 1%; (C) anti-PD-1 mAb + chemotherapy versus chemotherapy alone for patients with PD-L1 TPS 1–49%; (D) anti-PD-L1 mAb + chemotherapy versus chemotherapy alone for patients with PD-L1 TPS 1–49%; (E) anti-PD-1 mAb + chemotherapy versus chemotherapy alone for patients with PD-L1 TPS > 50%; (F) anti-PD-L1 mAb + chemotherapy versus chemotherapy alone for patients with PD-L1 TPS > 50%.
Figure 1
Figure 1
Network meta-analysis plot. A Bayesian framework was used to generate comparisons between the median overall survival, the median progression-free survival, and the objective response rate. The size of the blue circle and thickness of the orange lines are proportional to the number of studies included. Solid lines represent meta-analyses, and dotted lines represent network meta-analyses performed.
Figure 2
Figure 2
PRISMA flow diagram: Literature search and selection following PRISMA guidelines. TKI, tyrosine kinase inhibitor; IO, immunotherapy; OS, overall survival; EGFR, epithelial growth factor receptor; ALK, anaplastic lymphoma kinase; ROS-1, ROS proto-oncogene 1 receptor kinase.
Figure 3
Figure 3
Forest plot for meta-analyses of median overall survival (mOS). (A) anti-PD-1 mAb + chemotherapy versus chemotherapy alone for all patients; (B) anti-PD-L1 mAb + chemotherapy versus chemotherapy alone for all patients; (C) anti-PD-1 mAb monotherapy versus chemotherapy alone for patients with PD-L1 TPS > 50%; (D) anti-PD-L1 mAb monotherapy versus chemotherapy alone for patients with PD-L1 TPS > 50%. Squares represent HRs of individual studies; rhombi represent HRs of meta-analyses.
Figure 4
Figure 4
Forest plot for meta-analyses of median progression-free survival (mPFS), objective response rate (ORR), and grade 3 and higher toxicities for chemoimmunotherapies. (A) mPFS, anti-PD-1 mAb + chemotherapy versus chemotherapy alone; (B) mPFS, anti-PD-L1 mAb + chemotherapy versus chemotherapy alone; (C) ORR, anti-PD-1 mAb + chemotherapy versus chemotherapy alone; (D) ORR, anti-PD-L1 mAb + chemotherapy versus chemotherapy alone; grade 3 and higher toxicities for anti-PD-1 mAb + chemotherapy (E) and anti-PD-L1 mAb + chemotherapy (F) versus chemotherapy alone. Squares represent HRs or ORs of individual studies; rhombi represent meta-analyses.
Figure 5
Figure 5
Forest plot for network meta-analyses of median overall survival (mOS), median progression-free survival (mPFS), objective response rate (ORR), and grade 3 or higher toxicities.

References

    1. Sung H., Ferlay J., Siegel R.L., Laversanne M., Soerjomataram I., Jemal A., Bray F. Global Cancer Statistics 2020: GLOBOCAN Estimates of Incidence and Mortality Worldwide for 36 Cancers in 185 Countries. CA Cancer J. Clin. 2021;71:209–249. doi: 10.3322/caac.21660. - DOI - PubMed
    1. Siegel R.L., Miller K.D., Jemal A. Cancer statistics, 2018. CA Cancer J. Clin. 2018;68:7–30. doi: 10.3322/caac.21442. - DOI - PubMed
    1. Larkin J., Chiarion-Sileni V., Gonzalez R., Grob J.-J., Rutkowski P., Lao C.D., Cowey C.L., Schadendorf D., Wagstaff J., Dummer R., et al. Five-Year Survival with Combined Nivolumab and Ipilimumab in Advanced Melanoma. N. Engl. J. Med. 2019;381:1535–1546. doi: 10.1056/NEJMoa1910836. - DOI - PubMed
    1. Motzer R.J., Tannir N.M., McDermott D.F., Arén Frontera O., Melichar B., Choueiri T.K., Plimack E.R., Barthélémy P., Porta C., George S., et al. Nivolumab plus Ipilimumab versus Sunitinib in Advanced Renal-Cell Carcinoma. N. Engl. J. Med. 2018;378:1277–1290. doi: 10.1056/NEJMoa1712126. - DOI - PMC - PubMed
    1. Finn R.S., Qin S., Ikeda M., Galle P.R., Ducreux M., Kim T.Y., Kudo M., Breder V., Merle P., Kaseb A.O., et al. Atezolizumab plus Bevacizumab in Unresectable Hepatocellular Carcinoma. N. Engl. J. Med. 2020;382:1894–1905. doi: 10.1056/NEJMoa1915745. - DOI - PubMed

Publication types