. 2023 Jul 3;11(7):1890.
doi: 10.3390/biomedicines11071890.

Fabrication of a Smart Fibrous Biomaterial That Harbors an Active TGF-β1 Peptide: A Promising Approach for Cartilage Regeneration

Affiliations

Fabrication of a Smart Fibrous Biomaterial That Harbors an Active TGF-β1 Peptide: A Promising Approach for Cartilage Regeneration

Aglaia Mantsou et al. Biomedicines. .

Abstract

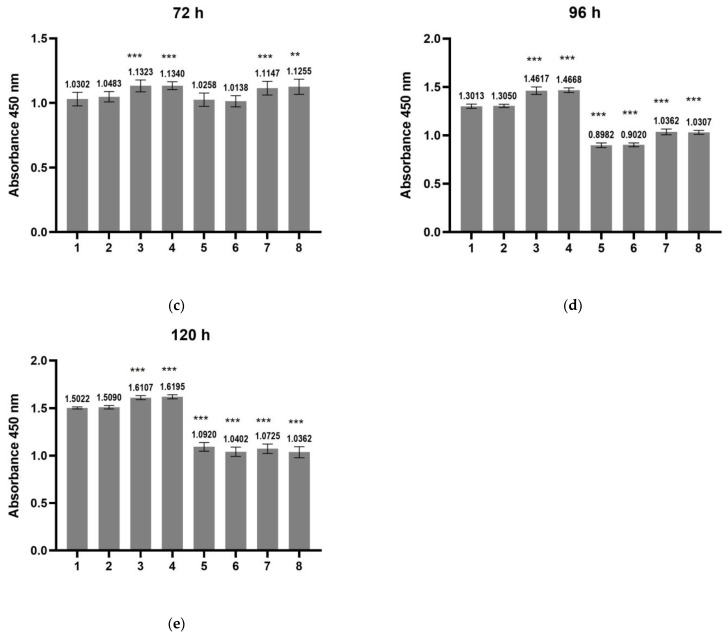
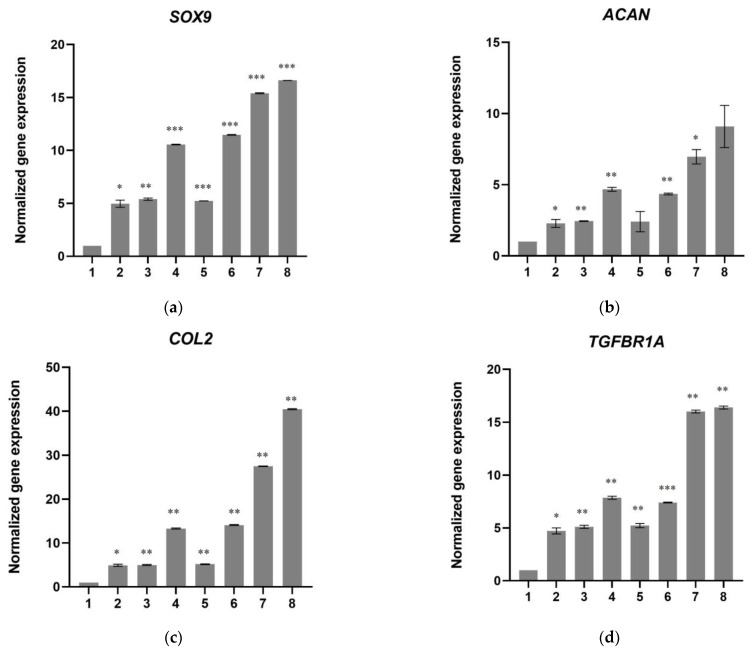
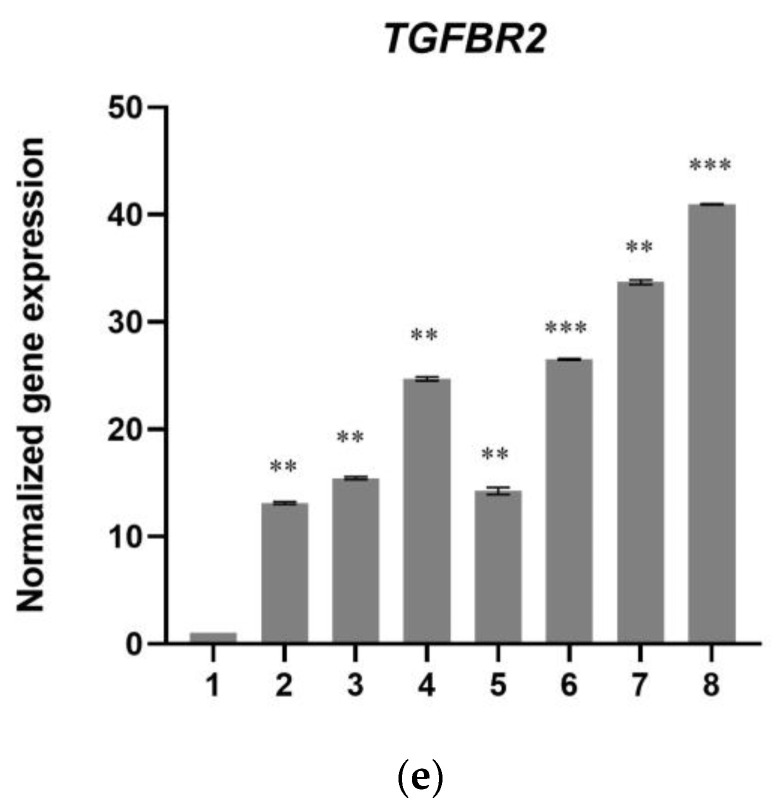
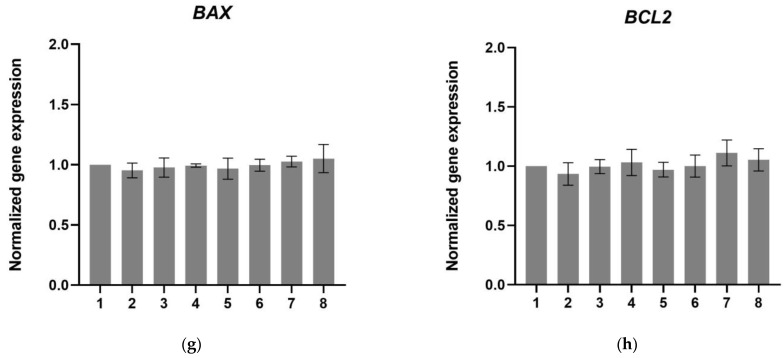
The regeneration of articular cartilage remains a serious problem in various pathological conditions such as osteoarthritis, due to the tissue's low self-healing capacity. The latest therapeutic approaches focus on the construction of biomaterials that induce cartilage repair. This research describes the design, synthesis, and investigation of a safe, "smart", fibrous scaffold containing a genetically incorporated active peptide for chondrogenic induction. While possessing specific sequences and the respective mechanical properties from natural fibrous proteins, the fibers also incorporate a Transforming Growth Factor-β1 (TGF-β1)-derived peptide (YYVGRKPK) that can promote chondrogenesis. The scaffold formed stable porous networks with shear-thinning properties at 37 °C, as shown by SEM imaging and rheological characterization, and were proven to be non-toxic to human dental pulp stem cells (hDPSCs). Its chondrogenic capacity was evidenced by a strong increase in the expression of specific chondrogenesis gene markers SOX9, COL2, ACAN, TGFBR1A, and TGFBR2 in cells cultured on "scaffold-TGFβ1" for 21 days and by increased phosphorylation of intracellular signaling proteins Smad-2 and Erk-1/2. Additionally, intense staining of glycosaminoglycans was observed in these cells. According to our results, "scaffold-TGFβ1" is proposed for clinical studies as a safe, injectable treatment for cartilage degeneration.

Keywords: TGF-β1 peptide; cartilage regeneration; chondrogenesis; elastin-like polypeptides; mussel-foot adhesive protein; silk fibroin; smart biomaterials; tissue engineering.


Conflict of interest statement

The authors declare no conflicts of interest.

Figures

Figure 1
Figure 1
Schematic representations of (a) the structure of the synthesized genes which encode the polypeptides that constitute the scaffold for chondrogenesis, and (b) the assembly of the gene “TGF-β1 peptide-(ELP10-Silk2-Mussel15)2-Mussel-6xHis”. Colors in (b) correspond to building blocks shown in (a). The schematics were created with BioRender.com (accessed on 24 May 2023).
Figure 2
Figure 2
(a) Electrophoresis in 8% w/v SDS-polyacrylamide gel of cell extracts before and after overexpression of the polypeptide “TGF-β1 peptide-(ELP10-Silk2-Mussel15)2-Mussel-6xHis” (20 μL of cell extract per lane). The band that corresponds to the overexpressed polypeptide is shown in the box. 0 h: before induction of overexpression, 4 h: 4 h after induction of overexpression with 1 mM IPTG. (b) Electrophoresis in 10% w/v SDS-polyacrylamide gels of the fractions after purification of the polypeptide from BL21 E. coli cells (10 μg of protein per lane). A total of 0–200 mM washes with solutions containing increasing concentrations of imidazole (0–200 mM), EL1–EL5: elution with solution containing 250 mM imidazole. M: protein marker.
Figure 3
Figure 3
(a,b) Imaging of the micromorphology of the porous surface of scaffold-TGFβ1 with SEM at different magnifications. Scale bars of 100 μm and 60 μm are included. (c) Macroscopic picture of scaffold-TGFβ1 on borosilicate glass coverslip.
Figure 4
Figure 4
Identification of the LVR of the crosslinked scaffold-TGFβ1. (a) Plot of the elastic (G′ ± 2 Pa) and viscous modulus (G″ ± 0.2 Pa) as a function of strain (%) in the crosslinked biomaterial at 37 °C. (b) Schematic representation of the behavior of the biomaterial at 37 °C in DMEM. The crosslinked scaffold-TGFβ1 behaves as a semi-rigid (B), rather than a fully flexible (C) or a rigid (A), polymer. Lines show the protein fibers and dots show crosslinking sites. Created with BioRender.com (accessed on 24 May 2023). All data correspond to different aliquots of the same samples in order to avoid preshearing effects or different sample preparations in order to show reproducibility.
Figure 5
Figure 5
The viscoelastic properties of crosslinked and uncrosslinked biomaterials within the LVR (at 3% strain). (a) Plot of the elastic (G′ ± 0.2 Pa) and viscous modulus (G″ ± 0.2 Pa) of crosslinked scaffold-TGFβ1 (6 mg/mL) as a function of time (s) at 37 °C. (b) Plot of the elastic modulus (G′) of crosslinked and uncrosslinked scaffolds (6 mg/mL in DMEM) as a function of time (s) at 37 °C (blue set: G′ ± 0.2 Pa, orange and grey sets: G′ ± 0.002 Pa). (c) Plot of the viscous modulus (G″) of crosslinked and uncrosslinked scaffolds (6 mg/mL) and culture medium DMEM as a function of time (s) at 37 °C (blue set: G′ ± 0.2 Pa, orange and grey sets: G′ ± 0.004 Pa, yellow set: G′ ± 0.0005 Pa). All data correspond to different aliquots of the same samples in order to avoid preshearing effects or different sample preparations in order to show reproducibility.
Figure 6
Figure 6
(a) Temperature sweep on the crosslinked scaffold-TGFβ1 at the range 10–40 °C. The viscoelastic properties of the crosslinked scaffold (G′ ± 0.2 Pa and G″ ± 0.2 Pa) showed a tendency to decrease with increasing temperature. (b) Frequency sweep on the crosslinked scaffold-TGFβ1 (6 mg/mL) at 37 °C (G′ ± 0.2 Pa and G″ ± 0.2 Pa). “η*”: dynamic viscosity. All data correspond to different aliquots of the same samples in order to avoid preshearing effects or different sample preparations in order to show reproducibility.
Figure 7
Figure 7
(a) Flow step on the uncrosslinked scaffold-TGFβ1 (6 mg/mL) at 37 °C. (b) Flow step on the crosslinked scaffold-TGFβ1 (6 mg/mL) at 37 °C. (c) Cox–Merz diagram of crosslinked scaffold-TGFβ1 (6 mg/mL) at 37 °C. (d) Flow step on the crosslinked compared to uncrosslinked scaffold-TFGβ1 (6 mg/mL) at 37 °C “η*”: dynamic viscosity. The standard deviation for dynamic viscosity was η* ± 0.0003 Pa·s. Schematics were made with BioRender.com (accessed on 24 May 2023).
Figure 8
Figure 8
Evaluation of the cytotoxicity of scaffold-TGFβ1 to hDPSCs, by MTT assay. The assay was performed at 3, 7, and 14 days of culture. The OD was measured at 570 nm with a reference filter at 630 nm. “Control”: hDPSCs in full a-MEM. The data are presented as mean ± SD values of % cell viability. Asterisks (*) and (**) indicate statistically significant differences (p ≤ 0.05 and p ≤ 0.01, respectively) compared to the control cells.
Figure 9
Figure 9
Evaluation of the proliferation of hDPSCs cultured on scaffold-TGFβ1 or scaffold without peptides or of hDPSCs treated with TGF-β1 peptide by BrdU assay. The assay was performed at 24 h (a), 48 h (b), 72 h (c), 96 h (d), and 120 h (e) of culture. (1) Control cells (hDPSCs cultured in complete α-ΜΕΜ), (2) hDPSCs cultured in complete α-ΜΕΜ and treated with 10 ng/mL TGF-β1 peptide, (3) hDPSCs cultured on scaffold without peptides in complete α-ΜΕΜ, (4) hDPSCs cultured on scaffold-TGFβ1 in complete α-ΜΕΜ, (5) hDPSCs cultured in chondrogenesis medium, (6) hDPSCs cultured in chondrogenesis and treated with 10 ng/mL TGF-β1 peptide, (7) hDPSCs cultured on scaffold without peptides in chondrogenesis medium, and (8) hDPSCs cultured on scaffold-TGFβ1 in chondrogenesis medium. The optical density (OD) was measured against a blank (cell-free and BrdU-free wells) at 450 nm with a reference filter at 690 nm. The data are presented as mean ± SD values of absorbance at 450 nm. Asterisks (**) and (***) indicate statistically significant differences (p ≤ 0.01 and p ≤ 0.001, respectively) compared to control cells.
Figure 9
Figure 9
Evaluation of the proliferation of hDPSCs cultured on scaffold-TGFβ1 or scaffold without peptides or of hDPSCs treated with TGF-β1 peptide by BrdU assay. The assay was performed at 24 h (a), 48 h (b), 72 h (c), 96 h (d), and 120 h (e) of culture. (1) Control cells (hDPSCs cultured in complete α-ΜΕΜ), (2) hDPSCs cultured in complete α-ΜΕΜ and treated with 10 ng/mL TGF-β1 peptide, (3) hDPSCs cultured on scaffold without peptides in complete α-ΜΕΜ, (4) hDPSCs cultured on scaffold-TGFβ1 in complete α-ΜΕΜ, (5) hDPSCs cultured in chondrogenesis medium, (6) hDPSCs cultured in chondrogenesis and treated with 10 ng/mL TGF-β1 peptide, (7) hDPSCs cultured on scaffold without peptides in chondrogenesis medium, and (8) hDPSCs cultured on scaffold-TGFβ1 in chondrogenesis medium. The optical density (OD) was measured against a blank (cell-free and BrdU-free wells) at 450 nm with a reference filter at 690 nm. The data are presented as mean ± SD values of absorbance at 450 nm. Asterisks (**) and (***) indicate statistically significant differences (p ≤ 0.01 and p ≤ 0.001, respectively) compared to control cells.
Figure 10
Figure 10
Relative quantification of the mRNA levels of chondrogenesis markers (a) SOX9, (b) ACAN, (c) COL2A1, (d) TGFBR1A, and (e) TGFBRR2 after 21 days of differentiation of hDPSCs on the scaffolds and without scaffold. (1) Control cells, (2) cells in chondrogenesis medium, (3) cells treated with 10 ng/mL TGF-β1 peptide (in α-MEM), (4) cells treated with 10 ng/mL TGF-β1 peptide (in chondrogenesis medium), (5) cells on scaffold without peptides (in α-ΜΕΜ), (6) cells on scaffold without peptides (in chondrogenesis), (7) cells on scaffold-TGFβ1 (in α-ΜΕΜ), and (8) cells on scaffold-TGFβ1 (in chondrogenesis medium). The normalization of Ct values was performed against two housekeeping genes, GAPDH and RPLPO. The data are presented as the mean ± SD values (n = 3). Asterisks (*), (**), and (***) indicate statistically significant differences (p ≤ 0.05, p ≤ 0.01 and p ≤ 0.001, respectively) compared to control cells.
Figure 10
Figure 10
Relative quantification of the mRNA levels of chondrogenesis markers (a) SOX9, (b) ACAN, (c) COL2A1, (d) TGFBR1A, and (e) TGFBRR2 after 21 days of differentiation of hDPSCs on the scaffolds and without scaffold. (1) Control cells, (2) cells in chondrogenesis medium, (3) cells treated with 10 ng/mL TGF-β1 peptide (in α-MEM), (4) cells treated with 10 ng/mL TGF-β1 peptide (in chondrogenesis medium), (5) cells on scaffold without peptides (in α-ΜΕΜ), (6) cells on scaffold without peptides (in chondrogenesis), (7) cells on scaffold-TGFβ1 (in α-ΜΕΜ), and (8) cells on scaffold-TGFβ1 (in chondrogenesis medium). The normalization of Ct values was performed against two housekeeping genes, GAPDH and RPLPO. The data are presented as the mean ± SD values (n = 3). Asterisks (*), (**), and (***) indicate statistically significant differences (p ≤ 0.05, p ≤ 0.01 and p ≤ 0.001, respectively) compared to control cells.
Figure 11
Figure 11
Relative quantification of the mRNA levels of (a) Osteocalcin, (b) COL1A1, (c) MMP9, (d) MMP13, (e) COL10A1, (f) PCNA, (g) BAX, and (h) BCL2 after 21 days of differentiation of hDPSCs on the scaffolds and without scaffold. (1) Control cells, (2) cells in chondrogenesis medium, (3) cells treated with 10 ng/mL TGF-β1 peptide (in α-MEM), (4) cells treated with 10 ng/mL TGF-β1 peptide (in chondrogenesis medium), (5) cells on scaffold without peptides (in α-ΜΕΜ), (6) cells on scaffold without peptides (in chondrogenesis), (7) cells on scaffold-TGFβ1 (in α-ΜΕΜ), and (8) cells on scaffold-TGFβ1 (in chondrogenesis medium). The normalization of Ct values was performed against two housekeeping genes, GAPDH and RPLPO. The data are presented as the mean ± SD values (n = 3). Asterisks (*), (**) and (***) indicate statistically significant differences (p ≤ 0.05, p ≤ 0.01 and p ≤ 0.001, respectively) compared to control cells. No statistically significant differences were observed between samples in BAX and BCL2 gene expression. MMP9, MMP13, and COL10A1 were detected after Ct = 37, while IL1b and TNFa mRNA levels were undetected in all samples.
Figure 11
Figure 11
Relative quantification of the mRNA levels of (a) Osteocalcin, (b) COL1A1, (c) MMP9, (d) MMP13, (e) COL10A1, (f) PCNA, (g) BAX, and (h) BCL2 after 21 days of differentiation of hDPSCs on the scaffolds and without scaffold. (1) Control cells, (2) cells in chondrogenesis medium, (3) cells treated with 10 ng/mL TGF-β1 peptide (in α-MEM), (4) cells treated with 10 ng/mL TGF-β1 peptide (in chondrogenesis medium), (5) cells on scaffold without peptides (in α-ΜΕΜ), (6) cells on scaffold without peptides (in chondrogenesis), (7) cells on scaffold-TGFβ1 (in α-ΜΕΜ), and (8) cells on scaffold-TGFβ1 (in chondrogenesis medium). The normalization of Ct values was performed against two housekeeping genes, GAPDH and RPLPO. The data are presented as the mean ± SD values (n = 3). Asterisks (*), (**) and (***) indicate statistically significant differences (p ≤ 0.05, p ≤ 0.01 and p ≤ 0.001, respectively) compared to control cells. No statistically significant differences were observed between samples in BAX and BCL2 gene expression. MMP9, MMP13, and COL10A1 were detected after Ct = 37, while IL1b and TNFa mRNA levels were undetected in all samples.
Figure 12
Figure 12
Western blotting against phospho-Smad-2, Smad-2, phospho-Erk1/2, Erk1/2, and GAPDH in protein extracts after 21 days of culture of hDPSCs on the scaffolds and without scaffold. (1) Control cells, (2) cells in chondrogenesis medium, (3) cells on scaffold without peptides (in α-ΜΕΜ), (4) cells on scaffold without peptides (in chondrogenesis), (5) cells on scaffold-TGFβ1 (in α-ΜΕΜ), and (6) cells on scaffold-TGFβ1 (in chondrogenesis medium). The bar charts depict phospho-Erk/Erk and phospho-Smad-2/Smad-2 ratios after quantification of band intensities in the blots, using the ImageJ 1.53t software. The data are presented as the mean ± SD values (n = 3). Asterisks (***) indicate statistically significant differences (p ≤ 0.001) compared to control cells.
Figure 13
Figure 13
Detection of glycosaminoglycans in the extracellular matrix by Alcian Blue staining after 21 days of culture of hDPSCs on scaffolds and without scaffolds. The photographs were taken at 10× magnification with a Nikon DS-Fi3 microscope camera. The 20-μm scale bars are included in all photographs.
Figure 14
Figure 14
SEM images at (a) and (a’) magnification 200×: (a) hDPSCs cells on borosilicate glass without scaffold-TGFβ1 after 21 days, (a’): hDPSCs cells on scaffold-TGFβ1 onto borosilicate glass after 21 days, (b) and (b’) magnification 500×: (b) hDPSCs cells on borosilicate glass without scaffold-TGFβ1 after 21 days, (b’): hDPSCs cells on scaffold-TGFβ1 onto borosilicate glass after 21 days and (c) and (c’) magnification 1000×: (c) hDPSCs cells on borosilicate glass without scaffold-TGFβ1 after 21 days, (c’): hDPSCs cells on scaffold-TGFβ1 onto borosilicate glass after 21 days. The porosity of scaffold-TGFβ1 structure is clearly shown in the images (a’,b’,c’).
Figure 15
Figure 15
Schematic representation of the signal transduction induced by the scaffold-TGFβ1 in human dental pulp stem cells. Upon binding of the TGF-β1 peptide to the ΤβRII/TβRI receptor complex, the activated TβRI receptor phosphorylates and activates intracellular Smad-2/3 and Erk-1/2. Activated Smad-2/3 forms a complex with co-Smad (Smad-4), which translocates to the nucleus and acts as transcriptional activator of chondrogenesis-inducing transcription factors, such as SOX9. Similarly, the phosphorylated Erk-1/2 translocates to the nucleus and activates transcriptional regulators of chondrogenesis genes. Eventually, both signaling pathways enhance the production of proteins involved in the formation of cartilage extracellular matrix (collagen type II -COL2- and aggrecan -ACAN-), as well as type ΤβRI (TGFBR1A) and ΤβRII (TGFBR2). Created with BioRender.com (accessed on 24 May 2023).

References

    1. Huey D.J., Hu J.C., Athanasiou K.A. Unlike Bone, Cartilage Regeneration Remains Elusive. Science. 2012;338:917–921. doi: 10.1126/science.1222454. - DOI - PMC - PubMed
    1. Sophia Fox A.J., Bedi A., Rodeo S.A. The Basic Science of Articular Cartilage: Structure, Composition, and Function. Sports Health. 2009;1:461–468. doi: 10.1177/1941738109350438. - DOI - PMC - PubMed
    1. Arden N., Nevitt M.C. Osteoarthritis: Epidemiology. Best Pract. Res. Clin. Rheumatol. 2006;20:3–25. doi: 10.1016/j.berh.2005.09.007. - DOI - PubMed
    1. Luna M. The Influence of the Gut Microbiome on Bone and Joint Disease. Cornell University; Ithaca, NY, USA: 2020.
    1. Gloria A., De Santis R., Ambrosio L. Polymer-Based Composite Scaffolds for Tissue Engineering. J. Appl. Biomater. Biomech. 2010;8:57–67. - PubMed