. 2023 Jul 4;11(7):1894.
doi: 10.3390/biomedicines11071894.

ERK Signaling Pathway Is Constitutively Active in NT2D1 Non-Seminoma Cells and Its Inhibition Impairs Basal and HGF-Activated Cell Proliferation

Affiliations

ERK Signaling Pathway Is Constitutively Active in NT2D1 Non-Seminoma Cells and Its Inhibition Impairs Basal and HGF-Activated Cell Proliferation

Luisa Gesualdi et al. Biomedicines. .

Abstract

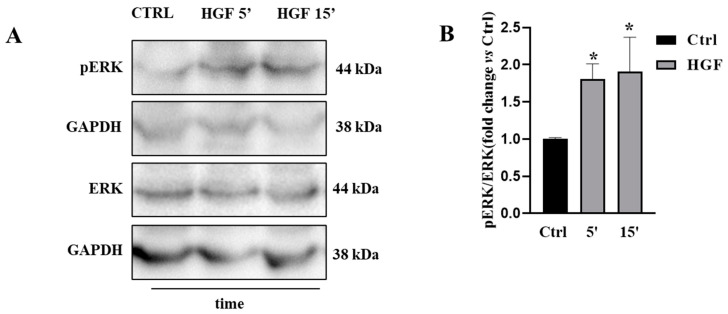
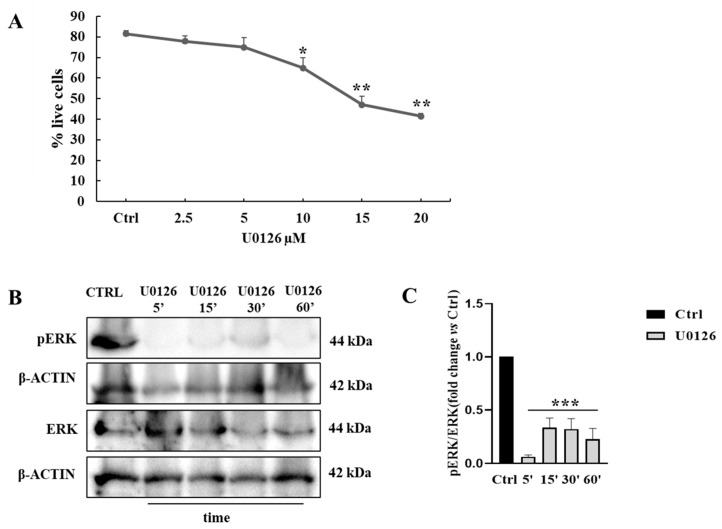
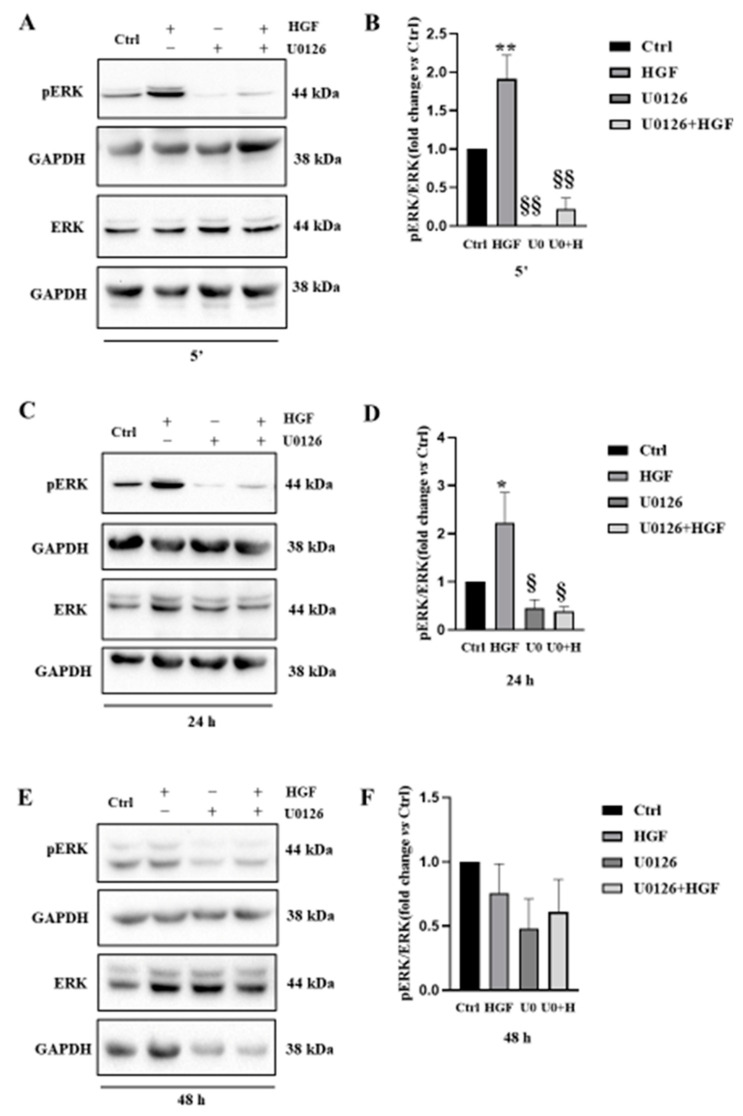
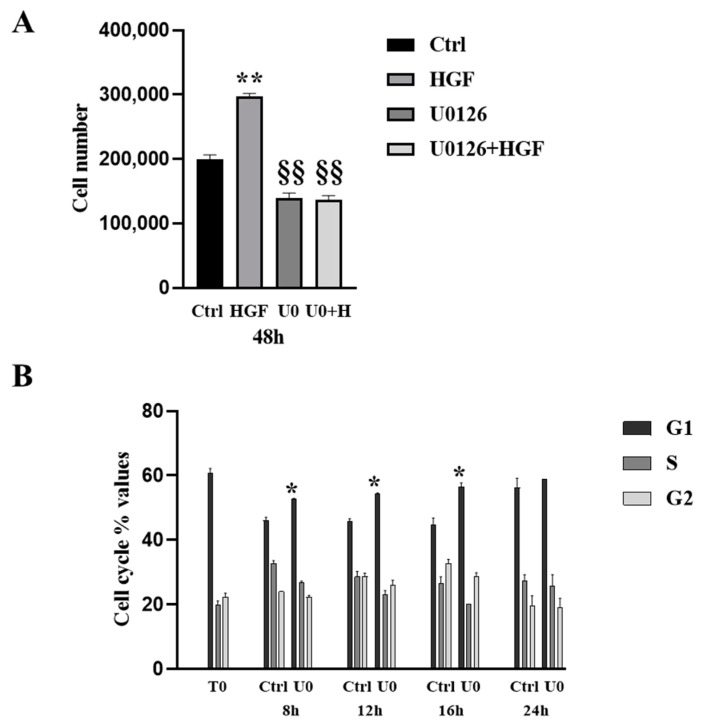
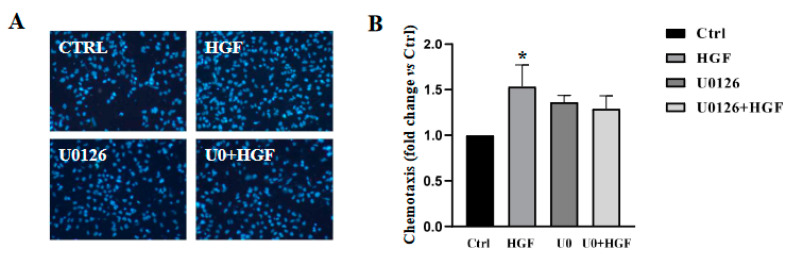
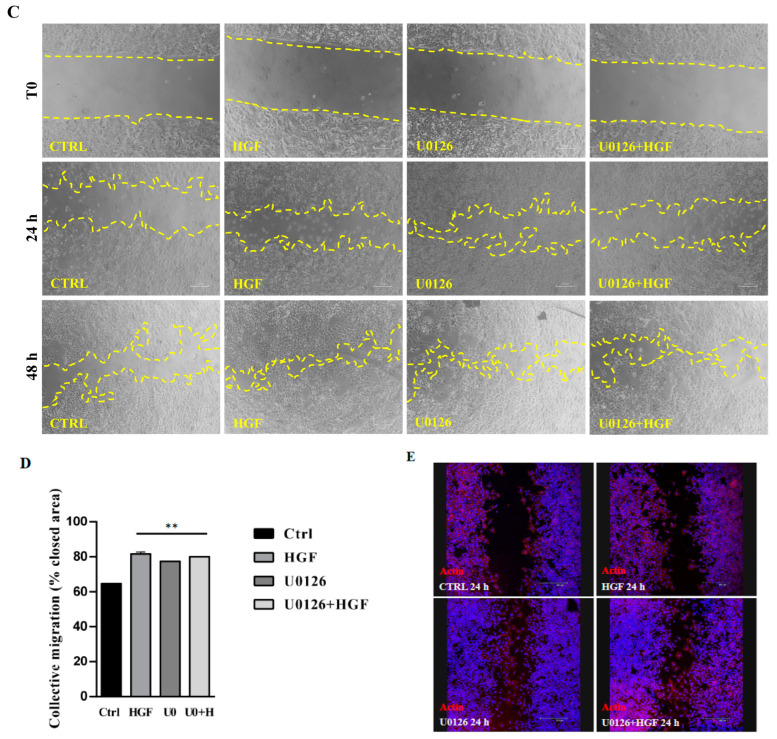
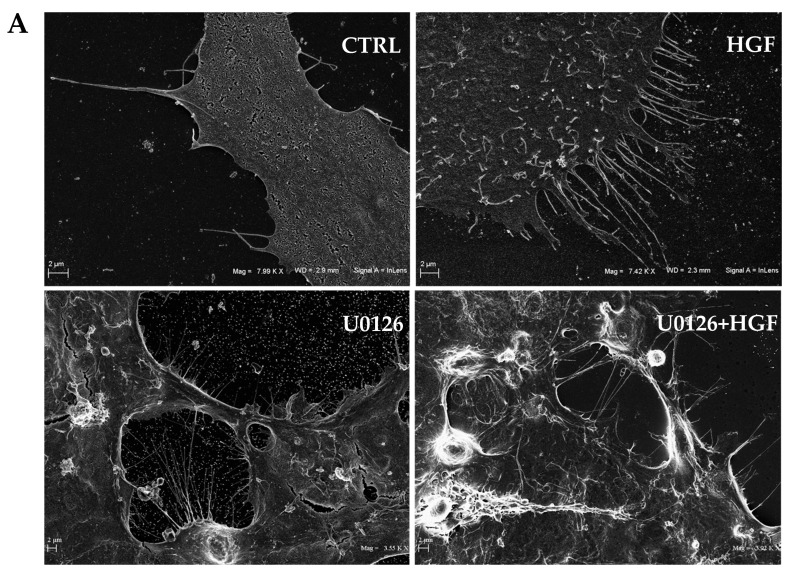
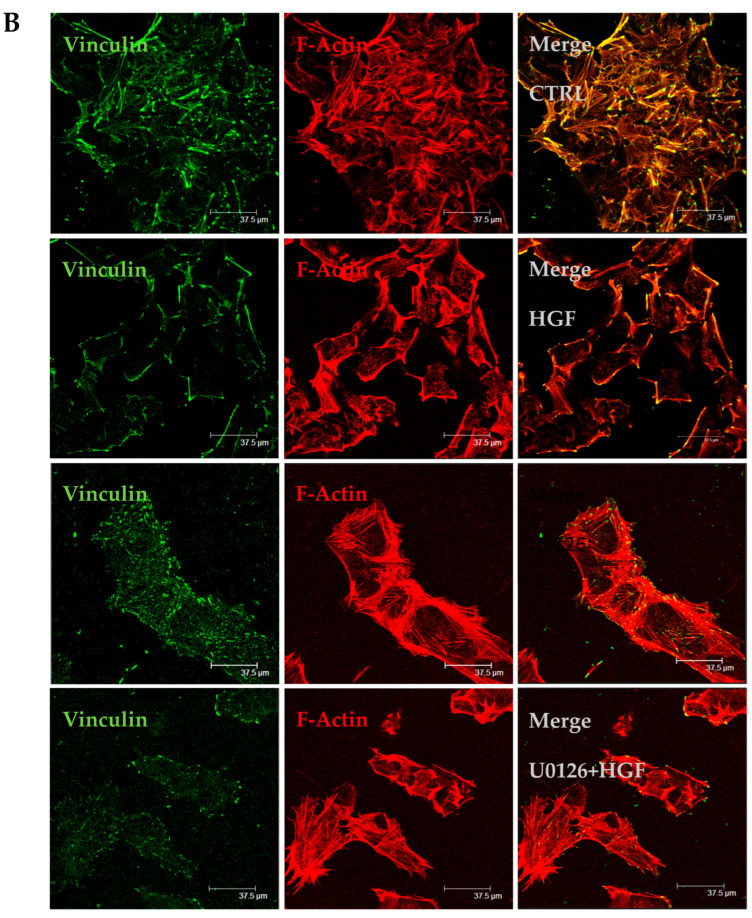
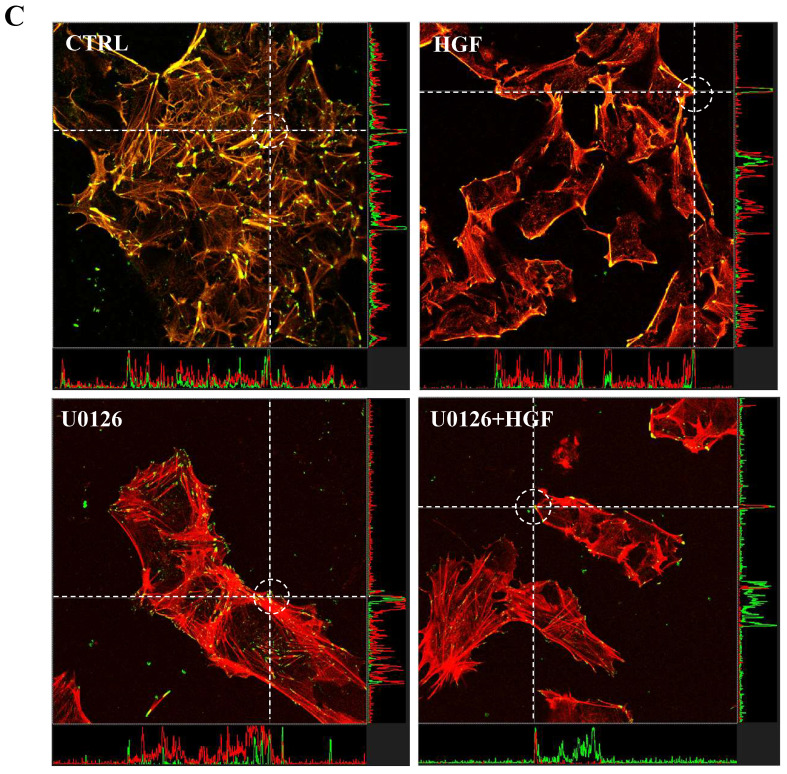
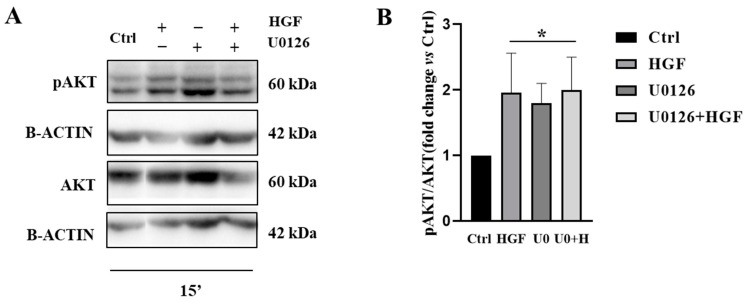
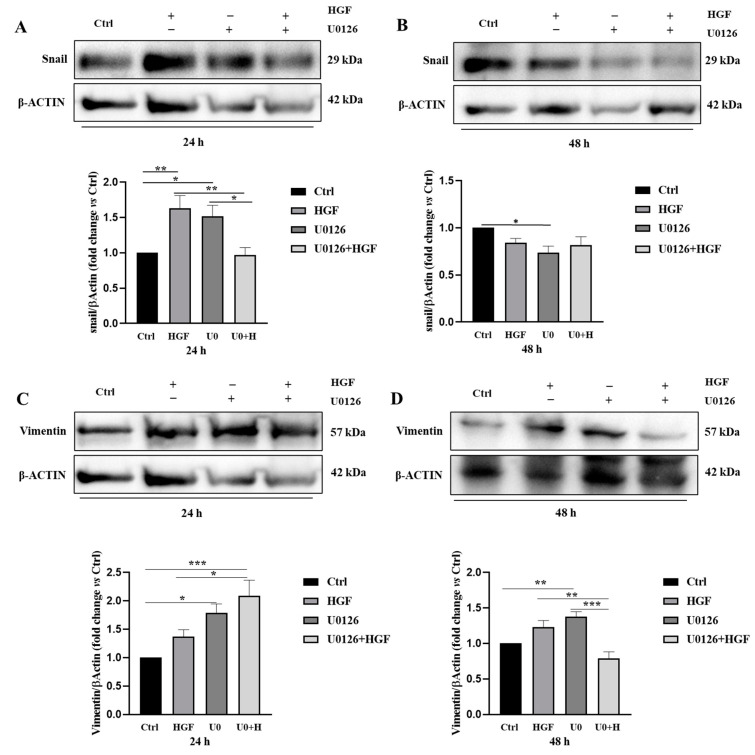
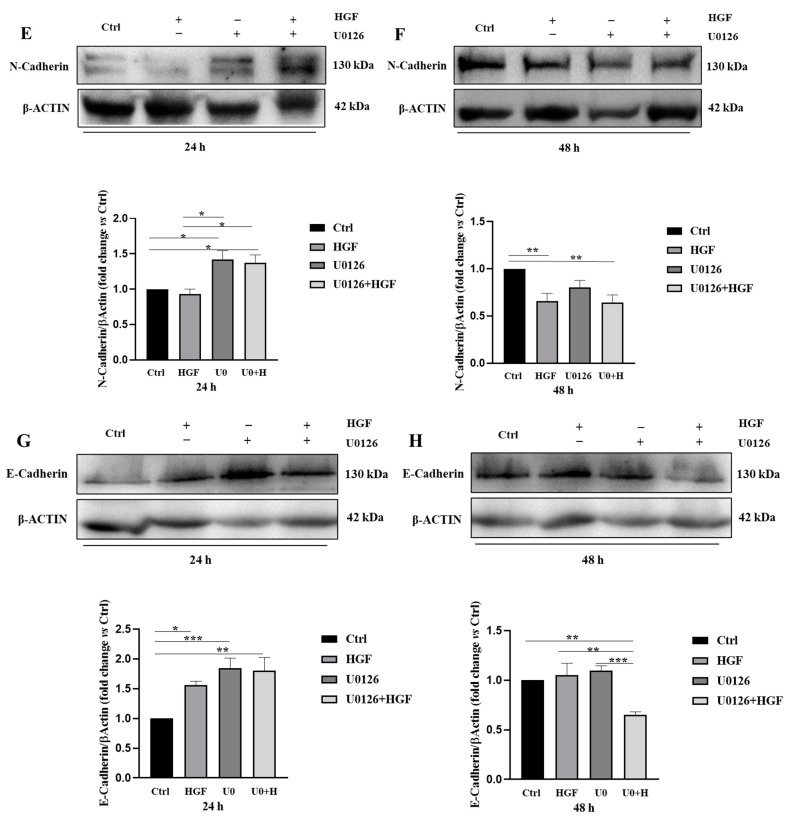
c-MET/hepatocyte growth factor (HGF) system deregulation is a well-known feature of malignancy in several solid tumors, and for this reason this system and its pathway have been considered as potential targets for therapeutic purposes. In previous manuscripts we reported c-MET/HGF expression and the role in testicular germ cell tumors (TGCTs) derived cell lines. We demonstrated the key role of c-Src and phosphatidylinositol 3-kinase (PI3K)/AKT adaptors in the HGF-dependent malignant behavior of the embryonal carcinoma cell line NT2D1, finding that the inhibition of these onco-adaptor proteins abrogates HGF triggered responses such as proliferation, migration, and invasion. Expanding on these previous studies, herein we investigated the role of mitogen-activated protein kinase (MAPK)/extracellular signal regulated kinase (ERK) pathways in the HGF-dependent and HGF-independent NT2D1 cells biological responses. To inhibit MAPK/ERK pathways we chose a pharmacological approach, by using U0126 inhibitor, and we analyzed cell proliferation, collective migration, and chemotaxis. The administration of U0126 together with HGF reverts the HGF-dependent activation of cell proliferation but, surprisingly, does not exert the same effect on NT2D1 cell migration. In addition, we found that the use of U0126 alone significantly promotes the acquisition of NT2D1 «migrating phenotype», while collective migration of NT2D1 cells was stimulated. Notably, the inhibition of ERK activation in the absence of HGF stimulation resulted in the activation of the AKT-mediated pathway, and this let us speculate that the paradoxical effects obtained by using U0126, which are the increase of collective migration and the acquisition of partial epithelium-mesenchyme transition (pEMT), are the result of compensatory pathways activation. These data highlight how the specific response to pathway inhibitors, should be investigated in depth before setting up therapy.

Keywords: MAPK/ERK pathway; c-Met/HGF system; testicular germ cell tumors; tumor microenvironment.


Conflict of interest statement

The authors declare no conflict of interest.

Figures

Figure 1
Figure 1
(A) Western Blot analyses of phospho- and total p44/42 MAP kinase (Erk1/Erk2) were performed on cells cultured in basal condition, 5, and 15 min after HGF administration (40 ng/mL). (B) Graphical representation of densitometric analyses of the bands (* vs. CTRL p < 0.05). Results are expressed in fold change, with the control considered as 1 (± standard error of the mean (S.E.M.)). Four independent experiments were performed.
Figure 2
Figure 2
(A) Cell death flow cytometry analysis on NT2D1 cells. Graphical representation of the percentage of live cells (fold change) obtained by culturing NT2D1 cell in control conditions and U0126 doses (2.5, 5, 10, 15, and 20 µM) (Mean ± S.E. is reported) (* p ≤ 0.05; ** p ≤ 0.01). (B) Western Blot analyses of phospho- and total ERK1/2 performed on cells cultured in basal condition and 5, 15, 30, 60 min after U0126 administration. (C) Graphical representation of densitometric analyses of the bands (5 µM) *** vs. CTRL p ≤ 0.001. Results are expressed in fold change, with the control considered as 1 (± S.E.M.)). Four independent experiments were performed.
Figure 3
Figure 3
(A,C,E) Western Blot analyses of phospho- and total ERK1/2 performed on cells cultured in basal condition and with HGF, U0126, U0126 + HGF for 5 min, 24 and 48 h. (B,D,F) Densitometric analyses of the bands are reported on the right (§§ vs. ** vs. Ctrl p < 0.01; § vs. * vs. Ctrl p < 0.05). Results are expressed in fold change, with the control considered as 1 (± standard error of the mean (S.E.M.)). Three independent experiments were performed.
Figure 4
Figure 4
(A) NT2D1 cell count after 48 h of culture in control condition (CTRL), or in medium supplemented with 40 ng/mL HGF, or 5 μM U0126, or the combination of both treatments (U0126 + HGF). As expected HGF administration causes a significant increase of cell number (** vs. CTRL p < 0.001). Conversely, U0126 alone or in combination with HGF triggers a significant reduction in cell number not only with respect to HGF treated samples (** vs. §§ p < 0.001), but also compared to control samples (CTRL vs. §§ p < 0.001). The experiment was repeated three times, and each experiment performed in triplicate. We reported in the graph the mean values ± S.E.M. (B) Cell cycle analysis of NT2D1 cells cultured for 8, 12, 16, 24 h in medium supplemented or not supplemented with U0126. The graph illustrated the mean percentage of cells for each phase of cell cycle ± S.E. We reported a significant increase of the percentage of G1 phase NT2D1 cells after 8 h, 12, 16 h U0126 administration (* p < 0.05). The experiment was repeated three times, and each experiment performed in triplicate.
Figure 5
Figure 5
(A,B): Effect of U0126 on cell NT2D1 cell migration (chemotaxis). (A) representative images of NT2D1 cell migration. Images were recorded at 20× magnification. At least three independent experiments were performed. (B) Quantitative analysis of chemo attracted NT2D1 cells. The values were calculated as “fold change” (±S.E.M.) compared to the control, which was considered as 1. U0126 in combination with HGF does not abrogate the migratory effect induced by HGF (* p < 0.05). (CE): Effect of U0126 on NT2D1 cell collective migration. (C) Representative images recovered immediately after insert removal (T0) 24 and 48 h after wounding. (Scale bar: 100 µm). (D) Quantitative analysis of wound closure after 48 h. Data are expressed as the mean percentage of closed area compared with the respective T0 condition (** p < 0.001). U0126 was not able to inhibit the collective migration of the cells cultured for 24 h and 48 h in presence of HGF (p = ns). Five independent experiments were performed. (E) Representative images of F-actin detection (red signal) in wound healing assay samples fixed after 24 h of culture. It is evident that the number of cells migrating as single cells is increased in treated samples (Scale bar: 100 µm).
Figure 5
Figure 5
(A,B): Effect of U0126 on cell NT2D1 cell migration (chemotaxis). (A) representative images of NT2D1 cell migration. Images were recorded at 20× magnification. At least three independent experiments were performed. (B) Quantitative analysis of chemo attracted NT2D1 cells. The values were calculated as “fold change” (±S.E.M.) compared to the control, which was considered as 1. U0126 in combination with HGF does not abrogate the migratory effect induced by HGF (* p < 0.05). (CE): Effect of U0126 on NT2D1 cell collective migration. (C) Representative images recovered immediately after insert removal (T0) 24 and 48 h after wounding. (Scale bar: 100 µm). (D) Quantitative analysis of wound closure after 48 h. Data are expressed as the mean percentage of closed area compared with the respective T0 condition (** p < 0.001). U0126 was not able to inhibit the collective migration of the cells cultured for 24 h and 48 h in presence of HGF (p = ns). Five independent experiments were performed. (E) Representative images of F-actin detection (red signal) in wound healing assay samples fixed after 24 h of culture. It is evident that the number of cells migrating as single cells is increased in treated samples (Scale bar: 100 µm).
Figure 6
Figure 6
(A) Scanning electron microscopy analysis. Representative images of NT2D1 cells cultured for 24 h in the control condition, or treated with HGF, U0126, or their combination. Scale bar 2 µm. (B) Representative confocal images of F-actin and vinculin organisation in NT2D1 cells during wound healing experiment, recovered at 24 h after the wound. Images were recovered at the leading edge of the wound: vinculin (green signal); F-actin (red signal); the merging picture is provided on the right side of the panel. Scale bar 37.5 µm. Three independent experiments were performed. (C) Colocalization analysis of vinculin (green) and F-actin (red) of the merging images reported in the panel (B). In the X/Y axes, at the level of the dotted lines, the colocalization (green and red picks) is shown. The analysis shows a colocalization of vinculin (green) and F-actin (red) peaks revealing also that this colocalization is mainly distributed in the central part of the cells in control samples, whereas it appears mostly displaced at the free front of cell membrane in treated cells.
Figure 6
Figure 6
(A) Scanning electron microscopy analysis. Representative images of NT2D1 cells cultured for 24 h in the control condition, or treated with HGF, U0126, or their combination. Scale bar 2 µm. (B) Representative confocal images of F-actin and vinculin organisation in NT2D1 cells during wound healing experiment, recovered at 24 h after the wound. Images were recovered at the leading edge of the wound: vinculin (green signal); F-actin (red signal); the merging picture is provided on the right side of the panel. Scale bar 37.5 µm. Three independent experiments were performed. (C) Colocalization analysis of vinculin (green) and F-actin (red) of the merging images reported in the panel (B). In the X/Y axes, at the level of the dotted lines, the colocalization (green and red picks) is shown. The analysis shows a colocalization of vinculin (green) and F-actin (red) peaks revealing also that this colocalization is mainly distributed in the central part of the cells in control samples, whereas it appears mostly displaced at the free front of cell membrane in treated cells.
Figure 7
Figure 7
(A) Western Blot analyses of phospho- and total AKT performed on cells cultured in basal condition and with HGF, U0126, U0126 + HGF for 15 min. Densitometric analyses of the bands are reported (B) (* vs. CTRL p < 0.01). Results were expressed in fold change, with the control considered as 1 (±standard error of the mean (S.E.M.)). Three independent experiments were performed.
Figure 8
Figure 8
Single treatments with HGF and U0126 induce a modulation of both epithelial and mesenchymal markers. U0126 + HGF treatment does not always restore the expression level to control values. (A,C,E,G) Western blot analyses of Snail, vimentin E-cadherin and N-cadherin in NT2D1 cell lines cultured in basal conditions (CTRL), with 5 µM U0126, with 40 ng/mL HGF, and with U0126 + HGF at 24 and 48 h (B,D,F,H). The densitometric analysis of the bands are reported for each protein (* p < 0.05; ** p < 0.01; *** p < 0.001). Results are expressed in fold change, with the control considered as 1 (± standard error of the mean (S.E.M.)). Four independent experiments were performed.
Figure 8
Figure 8
Single treatments with HGF and U0126 induce a modulation of both epithelial and mesenchymal markers. U0126 + HGF treatment does not always restore the expression level to control values. (A,C,E,G) Western blot analyses of Snail, vimentin E-cadherin and N-cadherin in NT2D1 cell lines cultured in basal conditions (CTRL), with 5 µM U0126, with 40 ng/mL HGF, and with U0126 + HGF at 24 and 48 h (B,D,F,H). The densitometric analysis of the bands are reported for each protein (* p < 0.05; ** p < 0.01; *** p < 0.001). Results are expressed in fold change, with the control considered as 1 (± standard error of the mean (S.E.M.)). Four independent experiments were performed.

Similar articles

Cited by

  • Omics Studies of Tumor Cells under Microgravity Conditions.
    Graf J, Schulz H, Wehland M, Corydon TJ, Sahana J, Abdelfattah F, Wuest SL, Egli M, Krüger M, Kraus A, Wise PM, Infanger M, Grimm D. Graf J, et al. Int J Mol Sci. 2024 Jan 11;25(2):926. doi: 10.3390/ijms25020926. Int J Mol Sci. 2024. PMID: 38255998 Free PMC article. Review.

References

    1. Yang X., Liao H.-Y., Zhang H.-H. Roles of MET in human cancer. Clin. Chim. Acta. 2022;525:69–83. doi: 10.1016/j.cca.2021.12.017. - DOI - PubMed
    1. Huang X., Chen Z., Zhang N., Zhu C., Lin X., Yu J., Chen Z., Lan P., Wan Y. Increase in CD4+FOXP3+ regulatory T cell number and upregulation of the HGF/c-Met signaling pathway during the liver metastasis of colorectal cancer. Oncol. Lett. 2020;20:2113–2118. doi: 10.3892/ol.2020.11785. - DOI - PMC - PubMed
    1. Faiella A., Riccardi F., Cartenì G., Chiurazzi M., Onofrio L. The Emerging Role of c-Met in Carcinogenesis and Clinical Implications as a Possible Therapeutic Target. J. Oncol. 2022;2022:5179182. doi: 10.1155/2022/5179182. - DOI - PMC - PubMed
    1. Scheri K.C., Leonetti E., Laino L., Gigantino V., Gesualdi L., Grammatico P., Bizzarri M., Franco R., Oosterhuis J.W., Stoop H., et al. c-MET receptor as potential biomarker and target molecule for malignant testicular germ cell tumors. Oncotarget. 2018;9:31842–31860. doi: 10.18632/oncotarget.25867. - DOI - PMC - PubMed
    1. Gesualdi L., Leonetti E., Cucina A., Scicchitano B.M., Sorrentino S., Tarsitano M.G., Isidori A., Bizzarri M., Filippini A., Riccioli A., et al. The PI3K/AKT Pathway Is Activated by HGF in NT2D1 Non-Seminoma Cells and Has a Role in the Modulation of Their Malignant Behavior. Int. J. Mol. Sci. 2020;21:8669. doi: 10.3390/ijms21228669. - DOI - PMC - PubMed