

Blood Profiling of Athletes after COVID-19: Differences in Blood Profiles of Post-COVID-19 Athletes Compared to Uninfected Athletic Individuals-An Exploratory Analysis
- PMID: 37509550
- PMCID: PMC10377547
- DOI: 10.3390/biomedicines11071911
Blood Profiling of Athletes after COVID-19: Differences in Blood Profiles of Post-COVID-19 Athletes Compared to Uninfected Athletic Individuals-An Exploratory Analysis
Abstract
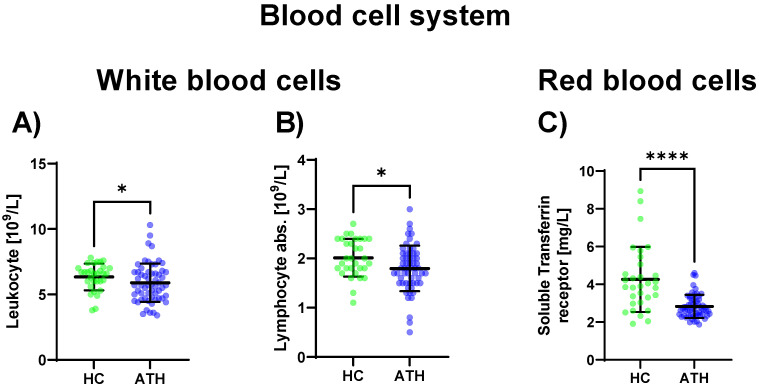
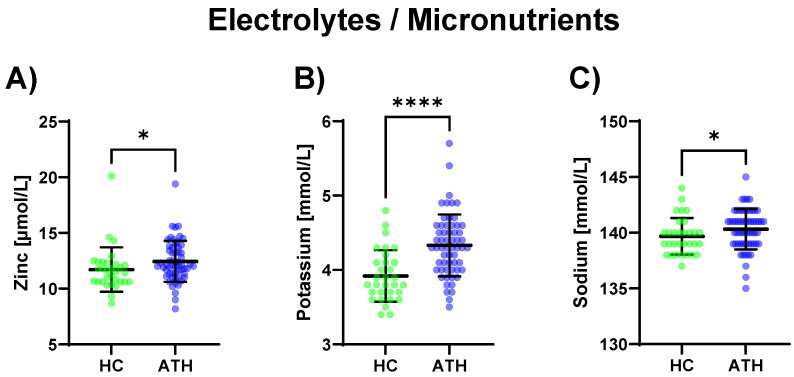
Blood profiling data in athletic populations and their respective responses to SARS-CoV-2 infection are lacking. Thus, this exploratory pilot study aimed to analyze and compare clinical blood markers in previously infected trained athletes (ATH; 30 m/29 f) and a not previously infected healthy athletic control group (HC; 12 m/19 f). The ATH group undertook a sports medical examination which included extended blood analyses. Blood profiles with a total of 74 variables were assessed (blood counts, pro-/inflammatory and immunological markers, and micronutrients), and the ATH group was compared to the age-matched, vaccinated HC group with comparable athletic back grounds, though without previous SARS-CoV-2-infections. The ATH group showed lower IgG, Troponin-T levels, and they had a lower complement/acute-phase protein activation. Furthermore, Vitamin D levels were lower and electrolyte/micronutrient concentrations were higher in ATH. Soluble transferrin receptor as a marker of erythrocyte turnover was decreased whereas PTT as a coagulation marker was increased. Subgroup analyses according to sex revealed more differences between the women of the ATH and HC groups (for 25 different variables) than between the men (for 5 different variables), especially for immunological and metabolic variables. In particular, the immune system and electrolyte/micronutrient status should be observed frequently and sex-specifically in this athletic cohort.
Keywords: COVID-19; athletes; blood analysis; inflammation; long-term changes; physical activity; reference values; sex differences.
Conflict of interest statement
The authors declare that this research was conducted in the absence of any commercial or financial relationships that could be construed as potential conflicts of interest.
Figures


Similar articles
-
Comparison of the heart function adaptation in trained and sedentary men after 50 and before 35 years of age.Am J Cardiol. 2011 Oct 1;108(7):1029-37. doi: 10.1016/j.amjcard.2011.05.043. Epub 2011 Jul 23. Am J Cardiol. 2011. PMID: 21784391
-
Severe Acute Respiratory Syndrome Coronavirus 2 (SARS-CoV-2) Infections and Reinfections Among Fully Vaccinated and Unvaccinated University Athletes-15 States, January-November 2021.Clin Infect Dis. 2022 Oct 3;75(Suppl 2):S236-S242. doi: 10.1093/cid/ciac529. Clin Infect Dis. 2022. PMID: 35771661 Free PMC article.
-
[Investigation of SARS-CoV-2-Specific Humoral and Cellular Immunity Values in Health Care Workers with COVID-19 Disease and Administered with COVID-19 Vaccine].Mikrobiyol Bul. 2022 Jul;56(3):480-492. doi: 10.5578/mb.20229708. Mikrobiyol Bul. 2022. PMID: 35960239 Turkish.
-
The effects of acute respiratory illness on exercise and sports performance outcomes in athletes - A systematic review by a subgroup of the IOC consensus group on "Acute respiratory illness in the athlete".Eur J Sport Sci. 2023 Jul;23(7):1356-1374. doi: 10.1080/17461391.2022.2089914. Epub 2022 Jul 8. Eur J Sport Sci. 2023. PMID: 35695464
-
American Medical Society for Sports Medicine position statement: concussion in sport.Br J Sports Med. 2013 Jan;47(1):15-26. doi: 10.1136/bjsports-2012-091941. Br J Sports Med. 2013. PMID: 23243113 Review.
References
-
- National Institute for Health and Care Excellence (Great Britain) COVID-19 Rapid Guideline: Managing the Long-Term Effects of COVID-19. National Institute for Health and Care Excellence (NICE); London, UK: 2020. - PubMed
-
- Cirulli E.T., Schiabor Barrett K.M., Riffle S., Bolze A., Neveux I., Dabe S., Grzymski J.J., Lu J.T., Washington N.L. Long-term COVID-19 symptoms in a large unselected population, 2020. medRxiv. 2020
-
- Bizjak D.A., John L., Matits L., Uhl A., Schulz S.V.W., Schellenberg J., Peifer J., Bloch W., Weiß M., Grüner B., et al. SARS-CoV-2 Altered Hemorheological and Hematological Parameters during One-Month Observation Period in Critically Ill COVID-19 Patients. Int. J. Mol. Sci. 2022;23:15332. doi: 10.3390/ijms232315332. - DOI - PMC - PubMed
LinkOut - more resources
Full Text Sources
Miscellaneous
