. 2023 Jul 24;11(7):2082.
doi: 10.3390/biomedicines11072082.

When Size Really Matters: The Eccentricities of Dystrophin Transcription and the Hazards of Quantifying mRNA from Very Long Genes

Affiliations

When Size Really Matters: The Eccentricities of Dystrophin Transcription and the Hazards of Quantifying mRNA from Very Long Genes

John C W Hildyard et al. Biomedicines. .

Abstract

At 2.3 megabases in length, the dystrophin gene is enormous: transcription of a single mRNA requires approximately 16 h. Principally expressed in skeletal muscle, the dystrophin protein product protects the muscle sarcolemma against contraction-induced injury, and dystrophin deficiency results in the fatal muscle-wasting disease, Duchenne muscular dystrophy. This gene is thus of key clinical interest, and therapeutic strategies aimed at eliciting dystrophin restoration require quantitative analysis of its expression. Approaches for quantifying dystrophin at the protein level are well-established, however study at the mRNA level warrants closer scrutiny: measured expression values differ in a sequence-dependent fashion, with significant consequences for data interpretation. In this manuscript, we discuss these nuances of expression and present evidence to support a transcriptional model whereby the long transcription time is coupled to a short mature mRNA half-life, with dystrophin transcripts being predominantly nascent as a consequence. We explore the effects of such a model on cellular transcriptional dynamics and then discuss key implications for the study of dystrophin gene expression, focusing on both conventional (qPCR) and next-gen (RNAseq) approaches.

Keywords: DMD; RNAseq; dystrophin; gene expression; mRNA; transcription.


Conflict of interest statement

The authors declare no conflict of interest.

Figures

Figure 1
Figure 1
The dystrophin gene. The dystrophin gene is located near the centre of the X chromosome (A) and represents ~2% of total X chromosomal sequence. The gene is comprised of 79 canonical exons (B), several of which are interspersed with large introns (>100 kb). The gene has seven distinct promoters (C), each of which contributes a unique first exon. Three generate full-length dystrophin (dp427c, m and p), while the remaining four are internal, giving rise to N-terminally truncated proteins designated by molecular weight: dp260, dp140, dp116 and dp71. At the protein level (D), full-length dystrophin carries an actin-binding N-terminus, a central rod domain of 24 spectrin-like repeats and a C-terminal dystroglycan-binding domain. Repeats 11–17 of the rod domain form a secondary actin-binding domain, and 16–17 bind nNOS. Repeats 20–23 confer microtubule-binding activity. The C-terminal domain also mediates interactions with syntrophins, dystrobrevin, sarcospan and sarcoglycans. Each truncated dystrophin isoform carries a subset of the full dystrophin functional milieu. In skeletal muscle, dystrophin is associated with the sarcolemma (E), where it associates with the eponymous dystrophin-associated glycoprotein complex (DAGC), a physical link between actin cytoskeleton and extracellular matrix (chromosomal ideogram adapted from National Center for Biotechnology Information, U.S. National Library of Medicine; other figure elements adapted from Hildyard et al. [9]).
Figure 2
Figure 2
Dystrophin transcript imbalance. Transcript imbalance can be detected using primers to 5′ (exons 1–2), central (exons 44–45) and 3′ (exons 62–63) regions of the 14 kb dp427 mRNA (A). Used with cDNA prepared from healthy (B) or mdx (C) murine skeletal muscle, these primers reveal markedly greater levels of 5′ sequence than 3′. This phenomenon is not dependent on genotype, but measured levels within dystrophic murine muscle show an en bloc reduction, with 3′ sequence being almost absent (figure adapted from Hildyard et al. [45]).
Figure 3
Figure 3
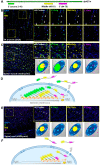
Dystrophin transcription as revealed by multiplex FISH. RNAscope 20-ZZ probes can be designed to the 5′ (exons 2–10), central (exon 45–51) and 3′ (exons 64–75) regions of the dp427 transcript to allow single-transcript multiplex FISH (A). Use of these probes in mature skeletal muscle tissue (B) or myotubes of developing (E16.5) embryos (C) reveals a consistent pattern: sarcoplasmic dp427 transcripts generate punctate foci of all three probes (see arrowheads, magnified insets i, ii, iii), while myonuclei show intense 5′ probe labelling, slightly less intense middle probe foci and minimal, exclusively punctate, labelling with 3′ probe (schematic below (Ciii)). A transcriptional model, whereby most dystrophin transcripts are nascent, and mature mRNAs are relatively short-lived, is consistent with this pattern (D) and with transcript imbalance shown in Figure 2. Expression of the shorter isoform dp140 within the embryonic (E16.5) spinal cord (E) produces prominent nuclear foci of middle probe but not 5′ probe, again consistent with a model whereby transcripts are predominantly nascent (F). Scalebars: 200 µm.
Figure 4
Figure 4
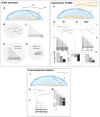
Overproduction with post-transcriptional control circumvents transcriptional delay. A conventional model, where transcriptional initiation matches mRNA demand, is sufficient under steady-state, basal conditions even with a 16 h transcription time (A), but increases in demand cannot be met over shorter timescales (B), and, similarly, a return to basal demand is also delayed (C). A model where transcription is always active and always in excess of demand, with levels controlled post-transcriptionally via degradation (D) is constitutively wasteful, but increases in demand (E) can be readily met over rapid timescales simply by reducing degradation. Similarly, a return to basal levels can be rapidly elicited by increasing degradation (F).
Figure 5
Figure 5
qPCR quantification under the unconventional dystrophin transcriptional model. cDNA synthesis: under this dystrophin transcriptional model, most transcripts are nascent rather than mature (A). Following mRNA isolation (B), only the full-length fraction of total dystrophin mRNAs carries polyA tails ((C), darker lines), while incomplete transcripts do not (lighter lines). cDNA synthesis via random priming (D) captures all dystrophin sequence (albeit fragmented), while oligo dT-directed priming (E) precludes any capture of nascent sequence and moreover biases towards polyA-adjacent 3′ sequence. Assessment of NMD: this transcriptional model influences assessment of nonsense-mediated decay, as only mature transcripts are subject to degradation (F). Assuming transcriptional initiation remains unchanged, both healthy (G) and dystrophic (H) RNA isolates will contain large numbers of nascent transcripts (i), which will be retained following random-primed cDNA synthesis (ii), and, consequently, qPCR directed to 5′ sequence will report little or no difference in measured expression, while changes in 3′ sequence will be more profound (iii): equivalent WT levels are shown as faint bars (H, iii). These differences become clearer when expressed as fold changes (I). Changes in transcriptional initiation (J) will instead produce en bloc reductions in all measured sequences (K,L), resulting in more consistent fold changes regardless of sequence position (M).
Figure 6
Figure 6
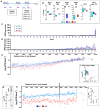
Lengthy transcription times influence responses to pharmacological intervention. Under basal conditions (A), most dystrophin transcripts are nascent, and thus measured levels of 5′ sequence are substantially greater than 3′. After 6 h of transcriptional initiation blockade (B), only measured levels of 5′ sequence report reductions from basal levels: transcripts initiated prior to blockade persist and are not affected, thus levels of central or 3′ sequence are unchanged. After 6 h of pharmacological washout (C), levels of 5′ and central sequence report changes, while 3′ sequence does not: initiation has resumed but a “gap” in the transcriptional procession persists, and transcripts initiated prior to the beginning of the experiment have still not reached completion; 18 h after the start of the experiment (D), levels of 5′ sequence remain reduced, while changes in central sequence become more marked, and 3′ sequence levels drop profoundly. A full 24 h after the start of the experiment (E), levels of 5′ and central sequence begin to return to basal values, while 3′ sequence remains markedly lower. Blockade of mRNA degradation (F) will increase fraction of mature transcripts, leading to en bloc increases in all sequence regions. Fold changes will be more prominent in 3′ sequence, reflecting lower initial levels.
Figure 7
Figure 7
Quantifying exon skipping and accounting for exon distribution. (A) Under this transcriptional model, use of antisense oligonucleotides to “skip” exons at the transcriptional level results in nascent transcripts bearing skipped (green regions) or unskipped (red regions) sequence (i,ii). Only skipped transcripts escape NMD and thus represent the bulk of measured 3′ sequence. This influences measured skipping efficiency (iii): only comparison of skipped sequence with sequence close to the skipping site correctly reflects true efficiency (here, 50%: dotted line). Comparison to 5′ sequence underestimates efficiency, while comparison to 3′ sequence will markedly overestimate efficiency. Exons are not distributed equidistantly along the dystrophin locus (B), and thus some sequence regions emerge markedly more rapidly than others. X axis indicates bases of genomic sequence; bars represent exon positions. Bar heights represent exon lengths: first exons are indicated. Non-muscle first exons are shown below the X axis for clarity. (C) Timeline for sequence transcription: 4 h are required to reach exon 6, while exons 10–41 emerge over ~2 h. All dp71 sequence (unique first exon and exons 63–79) is transcribed similarly rapidly. This renders some exonic regions more susceptible to transcript imbalance than others (D,E): assuming comparable transcriptional initiation, both healthy (light bars) and dystrophic (dark bars) mRNAs are predominantly nascent, while only mature dystrophic mRNAs are subject to NMD. Dystrophic reductions in 3′ sequence are profound and report dramatic fold changes, while reductions in 5′ sequence might be sufficiently modest to escape detection. The close genomic arrangement of exons 10–41, however, results in comparable (modest) transcript imbalance over this entire region (relative exon abundances are based on the model used throughout this manuscript, where nascent to mature mRNAs are at a ~10:3 ratio).
Figure 8
Figure 8
Exon-level analysis of dystrophin expression in healthy and dystrophic muscle. (A) Individual sequencing reads (blue/purple) are mapped to genomic features, such as exons of the Dmd locus. Conventionally, all reads to a given gene are summarised regardless of location (left box); however, use of custom feature files allows reads to be mapped on a per-exon basis, giving both overall read counts and counts per exon (right box). Note that reads overlapping multiple exons (blue) count for both. (B) Analysis of RNAseq datasets prepared from different healthy murine muscles: tibialis anterior (TA, light blue), soleus (SOL, dark blue) and extensor digitorum longus (EDL, red); all N = 6. Myosin heavy chain expression is consistent with muscle fibre type distribution, with faster MYH genes enriched in faster muscles, while dystrophin expression (Dmd) is comparable regardless of muscle. Counts of Dmd 3′ UTR alone (exon 79) are similar to counts of total Dmd. (C) Exon-level reads (reads per million, RPM) along the Dmd transcript show that most reads are to the 3′ UTR. (D) Adjusted for exon length (RPM.base−1), 3′ bias in read depth is readily apparent and consistent between muscles, and, when plotted against individual exon midpoints along the transcript (E), the processivity of reverse transcription can be estimated (−0.0005 log2(RPM).base−2, R2 = 0.89), corresponding to a 2-fold drop in reads for every 2000 bases from the 3′ end. First exon reads (F) are consistent with near-exclusive expression of dp427m. Conventional analysis of healthy (WT, dark blue, N = 3) and dystrophic (ΔEx51, red, N = 3) mouse muscle RNAseq data shows dystrophy-associated loss in Dmd reads (G), which exon-level analysis again confirms are chiefly represented by exon 79 sequence. A plot of RPM.base−1 against transcript position (H) shows loss of Dmd sequence in ΔEx51 muscle is essentially uniform across the entire length of the mRNA (with no reads to exon 51 in dystrophic muscle; see Ex51, shaded region); 3′ bias here is consistent with a 2-fold drop in reads per 7000 bases (−0.00014 log2(RPM).base−2, R2 = 0.57), and first exon reads (I) are again predominantly to dp427m.
Figure 9
Figure 9
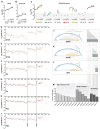
Exon-level analysis of dystrophin expression in embryonic and neonatal brain. (A) Conventional analysis of Dmd expression in murine brains collected from embryonic day 15.5 (E15.5) to postnatal day 29 (P29) shows a progressive increase in expression (N = 2 per time point). Exon-level analysis shows that ~20% of this can be attributed to exon 79 sequence alone (B), while first exon sequences reveal greater transcriptional complexity (C), with expression primarily represented by cortical full-length dystrophin (dp427c), dp140 and dp71. While both dp427c and dp71 show progressive increases in expression with age, expression of dp140 declines. Dashed line and grey box represent read threshold corresponding to stochastic noise (1–2 reads per dataset). Read counts along the transcript (DI) show no overt 3′ bias, instead demonstrating 5′ enrichment. Read counts increase markedly at exon 45 and exon 63 (shaded regions). These data demonstrate the advantages of ribodepletion and random priming in generation of RNAseq data for analysis of dystrophin expression and are consistent with a transcriptional model whereby substantial numbers of transcripts are present in nascent form, regardless of isoform: mapping of exonic reads from a mixed sample with expression of dp427 (J), dp140 (K) and dp71 (L) will generate a saw-tooth-like pattern of expression (M). Data derived from Schmitt et al. [56].

References

    1. Tennyson C.N., Klamut H.J., Worton R.G. The human dystrophin gene requires 16 hours to be transcribed and is cotranscriptionally spliced. Nat. Genet. 1995;9:184–190. doi: 10.1038/ng0295-184. - DOI - PubMed
    1. Gazzoli I., Pulyakhina I., Verwey N.E., Ariyurek Y., Laros J.F., ’t Hoen P.A., Aartsma-Rus A. Non-sequential and multi-step splicing of the dystrophin transcript. RNA Biol. 2016;13:290–305. doi: 10.1080/15476286.2015.1125074. - DOI - PMC - PubMed
    1. Warner L.E., DelloRusso C., Crawford R.W., Rybakova I.N., Patel J.R., Ervasti J.M., Chamberlain J.S. Expression of Dp260 in muscle tethers the actin cytoskeleton to the dystrophin-glycoprotein complex and partially prevents dystrophy. Hum. Mol. Genet. 2002;11:1095–1105. doi: 10.1093/hmg/11.9.1095. - DOI - PubMed
    1. Molza A.E., Mangat K., Le Rumeur E., Hubert J.F., Menhart N., Delalande O. Structural Basis of Neuronal Nitric-oxide Synthase Interaction with Dystrophin Repeats 16 and 17. J. Biol. Chem. 2015;290:29531–29541. doi: 10.1074/jbc.M115.680660. - DOI - PMC - PubMed
    1. Lai Y., Thomas G.D., Yue Y., Yang H.T., Li D., Long C., Judge L., Bostick B., Chamberlain J.S., Terjung R.L., et al. Dystrophins carrying spectrin-like repeats 16 and 17 anchor nNOS to the sarcolemma and enhance exercise performance in a mouse model of muscular dystrophy. J. Clin. Investig. 2009;119:624–635. doi: 10.1172/JCI36612. - DOI - PMC - PubMed

LinkOut - more resources