

Effect of Freezing on Soybean Protein Solution
- PMID: 37509741
- PMCID: PMC10379167
- DOI: 10.3390/foods12142650
Effect of Freezing on Soybean Protein Solution
Abstract
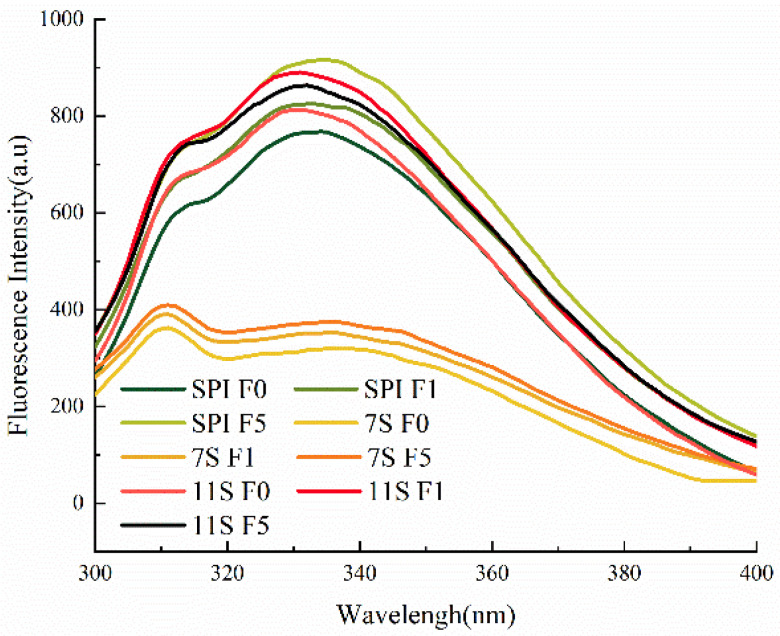
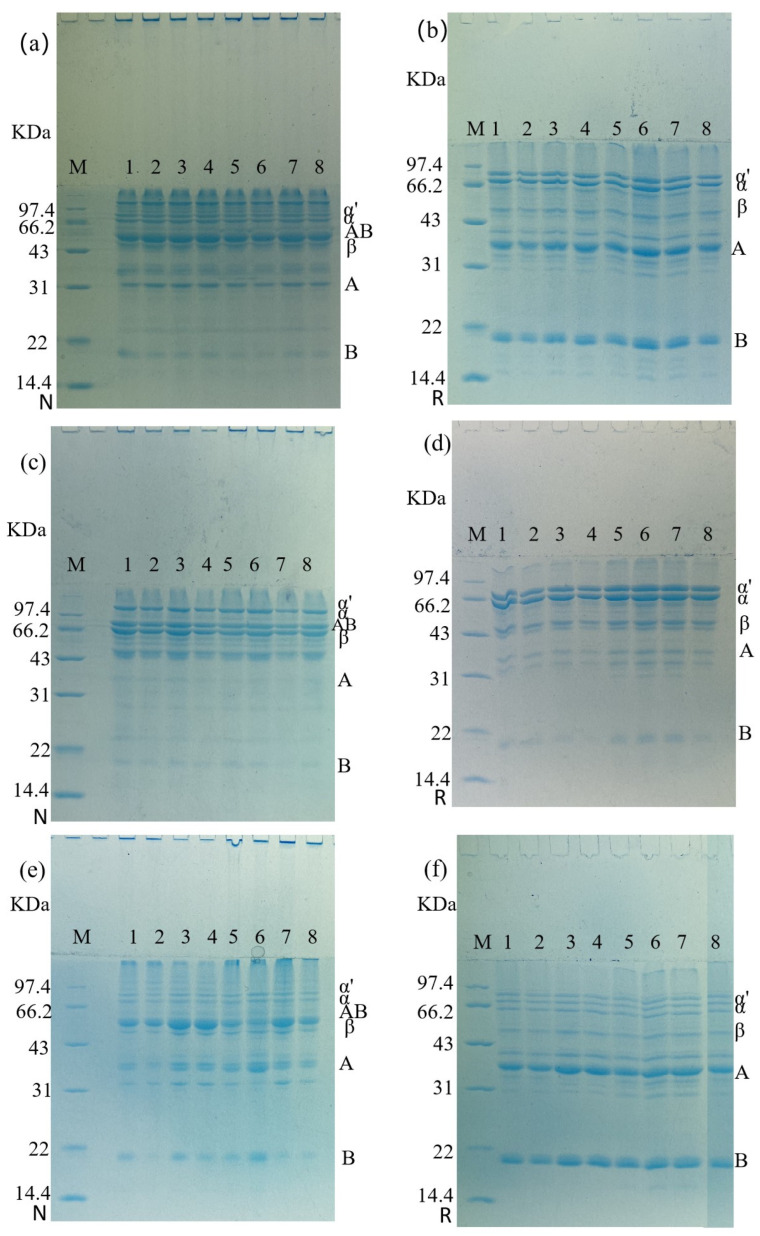
To investigate the impact of frozen storage conditions on the physicochemical properties of soybean protein and explore the underlying mechanisms, this study focused on soybean isolate (SPI), ß-soybean companion globulin (7S), and soybean globulin (11S). The protein solutions were prepared at a concentration of 2% and subjected to freezing for 1 and 5 days. Subsequently, the protein content, physicochemical properties, secondary structure, sulfhydryl content, and chemical interaction forces were assessed and analyzed using UV spectrophotometry, Zeta potential measurements, SDS-PAGE, Fourier infrared spectroscopy, and endogenous fluorescence photoemission spectroscopy. The obtained results revealed that the solubility and total sulfhydryl content of SPI, 7S, and 11S exhibited a decreasing trend with prolonged freezing time. Among them, 11S demonstrated the largest decrease in solubility and total sulfhydryl content, followed by SPI, and 7S the least. During freezing, the aromatic amino acids of SPI, 7S, and 11S molecules were exposed, leading to increased hydrophobicity, protein aggregation, and particle size enlargement, and the structure of the protein changed from disordered structure to ordered structure. After freezing, the polarity of the microenvironment of SPI, 7S, and 11S increased, and their maximum fluorescence emission wavelengths were red-shifted. Notably, the largest red shift of SPI was from 332 nm to 335 nm. As freezing time increased, the contribution of hydrogen bonding increased, while the contribution of hydrophobic interactions decreased. This indicates that freezing affects the hydrophobic interactions, hydrogen bonding, and other chemical forces of the protein. The growth of ice crystals leads to the unfolding of protein molecular chains, exposure of internal hydrophobic groups, enhancement of hydrophobicity, and alters the secondary structure of the protein.
Keywords: 11S; 7S; different freezing time; soybean isolate protein.
Conflict of interest statement
The authors declare no conflict of interest.
Figures


References
-
- Malhotra A., Coupland J.N. The effect of surfactants on the solubility, zeta potential, and viscosity of soy protein isolates. Food Hydrocoll. 2004;18:101–108. doi: 10.1016/S0268-005X(03)00047-X. - DOI
-
- Yu D., Zhang X., Zou W., Tang H., Yang F., Wang L., Elfalleh W. Raman spectroscopy analysis of the effect of electrolysis treatment on the structure of soy protein isolate. J. Food Meas. Charact. 2021;15:1294–1300. doi: 10.1007/s11694-020-00716-6. - DOI
-
- Mujoo R., Trinh D.T., Ng P.K.W. Characterization of storage proteins in different soybean varieties and their relationship to tofu yield and texture. Food Chem. 2003;82:265–273. doi: 10.1016/S0308-8146(02)00547-2. - DOI
-
- Ruíz-Henestrosa V.P., Sánchez C.C., Escobar M.D.M.Y., Jiménez J.J.P., Rodríguez F.M., Patino J.M.R. Interfacial and foaming characteristics of soy globulins as a function of pH and ionic strength. Colloids Surf. A Physicochem. Eng. Asp. 2007;309:202–215. doi: 10.1016/j.colsurfa.2007.01.030. - DOI
-
- Wang R. Interactions among Phytate, Calcium/Magnesium and Proteins in Soymilk and Their Effects on Protein Aggregation. China Agricultural University. 2018. [(accessed on 9 June 2023)]. Available online: https://kns.cnki.net/KCMS/detail/detail.aspx?dbname=CDFDLAST2018&filenam.... (In Chinese)
Grants and funding
LinkOut - more resources
Full Text Sources
Research Materials
