

Schizophrenia MEG Network Analysis Based on Kernel Granger Causality
- PMID: 37509953
- PMCID: PMC10378589
- DOI: 10.3390/e25071006
Schizophrenia MEG Network Analysis Based on Kernel Granger Causality
Abstract
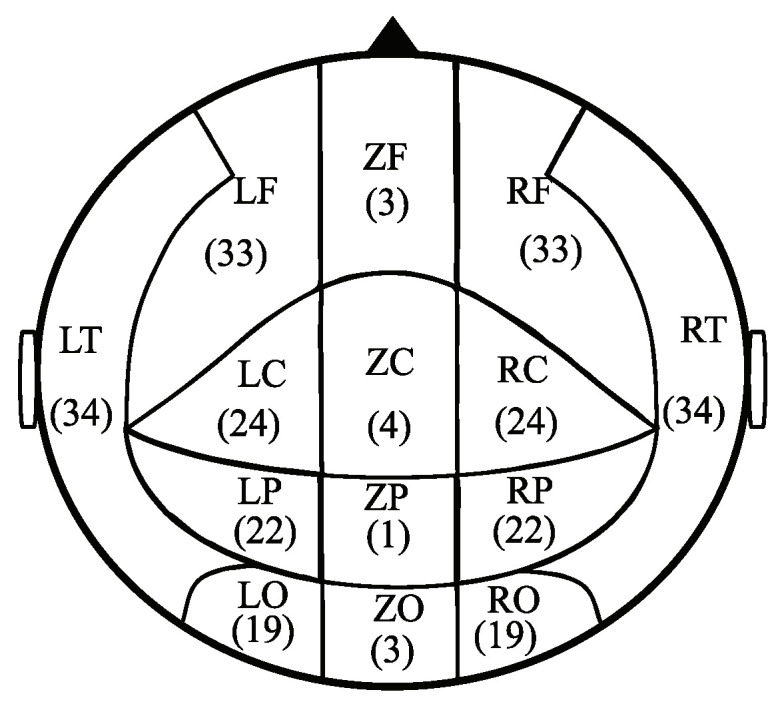
Network analysis is an important approach to explore complex brain structures under different pathological and physiological conditions. In this paper, we employ the multivariate inhomogeneous polynomial kernel Granger causality (MKGC) to construct directed weighted networks to characterize schizophrenia magnetoencephalography (MEG). We first generate data based on coupled autoregressive processes to test the effectiveness of MKGC in comparison with the bivariate linear Granger causality and bivariate inhomogeneous polynomial kernel Granger causality. The test results suggest that MKGC outperforms the other two methods. Based on these results, we apply MKGC to construct effective connectivity networks of MEG for patients with schizophrenia (SCZs). We measure three network features, i.e., strength, nonequilibrium, and complexity, to characterize schizophrenia MEG. Our results suggest that MEG of the healthy controls (HCs) has a denser effective connectivity network than that of SCZs. The most significant difference in the in-connectivity strength is observed in the right frontal network (p=0.001). The strongest out-connectivity strength for all subjects occurs in the temporal area, with the most significant between-group difference in the left occipital area (p=0.0018). The total connectivity strength of the frontal, temporal, and occipital areas of HCs exhibits higher values compared with SCZs. The nonequilibrium feature over the whole brain of SCZs is significantly higher than that of the HCs (p=0.012); however, the results of Shannon entropy suggest that healthy MEG networks have higher complexity than schizophrenia networks. Overall, MKGC provides a reliable approach to construct MEG brain networks and characterize the network characteristics.
Keywords: complexity; effective network; kernel Granger causality; nonequilibrium; schizophrenia MEG.
Conflict of interest statement
The authors declare no competing interest.
Figures


Similar articles
-
Nonlinear effective connectivity measure based on adaptive Neuro Fuzzy Inference System and Granger Causality.Neuroimage. 2018 Nov 1;181:382-394. doi: 10.1016/j.neuroimage.2018.07.024. Epub 2018 Jul 19. Neuroimage. 2018. PMID: 30010006
-
Network Analysis of Depression Using Magnetoencephalogram Based on Polynomial Kernel Granger Causality.Entropy (Basel). 2023 Sep 13;25(9):1330. doi: 10.3390/e25091330. Entropy (Basel). 2023. PMID: 37761629 Free PMC article.
-
Magnetoencephalographic and functional MRI connectomics in schizophrenia via intra- and inter-network connectivity.Neuroimage. 2017 Jan 15;145(Pt A):96-106. doi: 10.1016/j.neuroimage.2016.10.011. Epub 2016 Oct 8. Neuroimage. 2017. PMID: 27725313 Free PMC article.
-
NLGC: Network localized Granger causality with application to MEG directional functional connectivity analysis.Neuroimage. 2022 Oct 15;260:119496. doi: 10.1016/j.neuroimage.2022.119496. Epub 2022 Jul 21. Neuroimage. 2022. PMID: 35870697 Free PMC article.
-
[The Granger causality models and their applications in brain effective connectivity networks].Sheng Wu Yi Xue Gong Cheng Xue Za Zhi. 2013 Dec;30(6):1343-9. Sheng Wu Yi Xue Gong Cheng Xue Za Zhi. 2013. PMID: 24645623 Review. Chinese.
Cited by
-
Causalized Convergent Cross Mapping and Its Implementation in Causality Analysis.Entropy (Basel). 2024 Jun 24;26(7):539. doi: 10.3390/e26070539. Entropy (Basel). 2024. PMID: 39056902 Free PMC article.
References
-
- Schizophrenia. [(accessed on 1 June 2023)]. Available online: https://www.who.int/news-room/fact-sheets/detail/schizophrenia.
Grants and funding
LinkOut - more resources
Full Text Sources
