Review
. 2023 Jul 12;13(14):2353.
doi: 10.3390/diagnostics13142353.

Neurological and Psychiatric Manifestations of Long COVID-19 and Their [18F]FDG PET Findings: A Review

Affiliations
Review

Neurological and Psychiatric Manifestations of Long COVID-19 and Their [18F]FDG PET Findings: A Review

Rizwanullah Hameed et al. Diagnostics (Basel). .

Abstract

For more than two years, lingering sequalae of COVID-19 have been extensively investigated. Approximately 10% of individuals infected by COVID-19 have been found to experience long-term symptoms termed "long COVID-19". The neurological and psychiatric manifestations of long COVID-19 are of particular concern. While pathogenesis remains unclear, emerging imaging studies have begun to better elucidate certain pathological manifestation. Of specific interest is imaging with [18F]FDG PET which directly reflects cellular glycolysis often linked to metabolic and inflammatory processes. Seeking to understand the molecular basis of neurological features of long COVID-19, this review encompasses the most recent [18F]FDG PET literature in this area.

Keywords: COVID-19; PET; [18F]FDG; long COVID-19; neurologic; positron emission tomography; psychiatric.


Conflict of interest statement

The authors declare no conflict of interest.

Figures
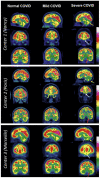
Figure 1
Figure 1
All sets of figures depict [18F]FDG PET brain scans of long COVID-19 patients from three different French nuclear medicine centers (depicted in 3 boxes: Nancy, Paris, and Marseilles). These images were captured ranging from 168 days to 545 days after onset of COVID-19. The entire left column depicts normal PET scans, the middle column depicts mild-to-moderate PET hypometabolism, and the right column depicts severe long COVID-19 hypometabolic patterns. The first column with normal PET pattern from top to the bottom includes a 44-year-old woman (with dyspnea and tachycardia), a 35-year-old woman (with persistent asthenia, headache, polyarthralgia, sleep issues, and memory impairment), and a 50-year-old woman (with headache, memory impairment, and anosmia). The middle column consists of images with mild-to-moderate PET hypometabolism, from top to bottom, include a 41-year-old man (with asthenia, dyspnea, and cognitive issues), a 52-year-old woman (with cognitive impairment, asthenia, insomnia, and muscle weakness) and a 55-year-old woman (with memory concerns, headaches, and dyspnea). The right column shows severe PET hypometabolism. From top to bottom, a 37-year-old woman (with dyspnea, orthostatic hypotension, excessive sleep, fever, and cognitive issues), a 38-year-old woman (with memory problems, dizziness, asthenia, polyarthralgia, and myalgia) and a 20-year-old woman (with asthenia, headache, and impairment of memory and concentration). Severe hypometabolic patterns are indicated by arrows: white arrows show the fronto-orbital olfactory regions, red arrows show the other limbic/paralimbic regions, grey for the pons, and yellow for the cerebellum. Reproduced with permission from reference Verger et al. [43].
Figure 2
Figure 2
[18F]FDG PET hypometabolism in the brain of first patient. Reduced [18F]FDG metabolism in the olfactory/rectal gyrus was observed on both sides (indicated by white arrow) and was confirmed by whole-brain voxel-based SPM8 analysis compared to healthy controls (p voxel < 0.001; p-cluster < 0.05; uncorrected). Reproduced with permission from reference Guedj et al. [45].
Figure 3
Figure 3
[18F]FDG PET hypometabolism in the brain of the second patient. Reduced [18F]FDG metabolism in the olfactory and rectal gyrus (indicated by white arrow), medial temporal lobe (indicated by white *), and brainstem (indicated by white +) were observed. The findings were confirmed with whole-brain voxel-based SPM8 analysis compared to healthy controls (p voxel < 0.001; p-cluster < 0.05; uncorrected). Additionally, other areas of reduced [18F]FDG metabolism identified were pre- and post-central gyrus on the right side, superior temporal gyrus on the right side, thalamus on both sides, hypothalamus, and the cerebellum. Reproduced with permission from reference Guedj et al. [45].
Figure 4
Figure 4
The study examined brain metabolism using [18F]FDG PET scans in patients with long COVID-19 and compared them with healthy control. The results showed that the patients with long COVID-19 had lower [18F]FDG metabolic activity in specific brain regions such as bilateral rectal and orbital gyrus, including the olfactory gyrus; the right temporal lobe, which includes the amygdala and hippocampus and extends to the right thalamus; the bilateral pons and medulla in the brainstem; and the bilateral cerebellum (colored regions). The study employed SPM8 3D rendering to visualize the findings (p-voxel < 0.001 uncorrected and p-cluster < 0.05 FWE-corrected). Reproduced with permission from reference [44].
Figure 5
Figure 5
In this study, [18F]FDG PET scans were performed on seven pediatric patients (P1 to P7), with follow-up scans conducted for two of them (P4b and P7b). These patients’ main complaints were fatigue, memory issues, and cognitive impairment. A PET scan depicting normal glucose metabolism in a 10-year-old child (C) was also included for reference. The findings revealed reduced metabolic activity in the olfactory regions for children P, 3, 4, 5, and 6; in the temporal regions for children P1, 3, 4, 5, 6, and 7; in the brainstem for children P1, 3, 4, 5, 6, and 7; and in the cerebellum for all the children. During follow-up [18F]FDG PET, brain metabolism had improved, especially in the brainstem. Reproduced with permission from reference [48].
Figure 6
Figure 6
The study examined changes in brain metabolism in COVID-19 patients compared to healthy controls (total of 32 individuals) at different time points: during the acute phase, one month, and six months after the onset of COVID-19. Statistical parametric mapping (SPM) T maps were created for each patient (#1 to #7), displaying hypermetabolism (hot color scale) and hypometabolism (cool color scale) in axial orthogonal views using neurological convention (right side of the image corresponds to the patient’s right). R, right; L, left. The 3D rendering showed the right hemisphere for all patients, except for patient #4, who exhibited hypometabolism in the left frontal cortex due to a focal seizure. Reproduced with permission from reference [54].
Figure 7
Figure 7
The study conducted a group analysis of [18F]FDG PET scans in COVID-19 patients at the subacute and chronic stages. The first and second rows display transaxial sections of the group-averaged, spatially normalized [18F]FDG PET scans of eight patients who initially required inpatient treatment for non-neurologic complications. The third row presents regions with significant increases in normalized [18F]FDG uptake in COVID-19 patients at the chronic stage compared to the subacute stage, as determined by statistical parametric mapping analysis (paired t-test, p < 0.01, false-discovery rate corrected). The fourth row depicts regions that still exhibit significant decreases in normalized [18F]FDG uptake in COVID-19 patients at the chronic stage compared to an age-matched control group (2-sample t-test, p < 0.005). The statistical parametric mapping (SPM) 12 t-values are color coded and overlaid onto an MRI template. The images are presented in neurologic orientation, i.e., the left side corresponds to the patient’s left and vice versa. The numbers on the images denote the axial (z) position in millimeters. Reproduced with permission from reference [55].

Similar articles

Cited by

References

    1. Alimohamadi Y., Sepandi M., Taghdir M., Hosamirudsari H. Determine the Most Common Clinical Symptoms in COVID-19 Patients: A Systematic Review and Meta-Analysis. J. Prev. Med. Hyg. 2020;61:E304–E312. doi: 10.15167/2421-4248/jpmh2020.61.3.1530. - DOI - PMC - PubMed
    1. Mahase E. Covid-19: Sore Throat, Fatigue, and Myalgia Are More Common with New UK Variant. BMJ. 2021;372:n288. doi: 10.1136/bmj.n288. - DOI - PubMed
    1. Shah S., Danda D., Kavadichanda C., Das S., Adarsh M.B., Negi V.S. Autoimmune and Rheumatic Musculoskeletal Diseases as a Consequence of SARS-CoV-2 Infection and Its Treatment. Rheumatol. Int. 2020;40:1539–1554. doi: 10.1007/s00296-020-04639-9. - DOI - PMC - PubMed
    1. Jain U. Effect of COVID-19 on the Organs. Cureus. 2020;12:e9540. doi: 10.7759/cureus.9540. - DOI - PMC - PubMed
    1. Iadecola C., Anrather J., Kamel H. Effects of COVID-19 on the Nervous System. Cell. 2020;183:16–27.e1. doi: 10.1016/j.cell.2020.08.028. - DOI - PMC - PubMed

LinkOut - more resources