. 2023 Jul 13;13(14):2363.
doi: 10.3390/diagnostics13142363.

Mitochondrial Dysfunction in Peripheral Blood Mononuclear Cells as Novel Diagnostic Tools for Non-Alcoholic Fatty Liver Disease: Visualizing Relationships with Known and Potential Disease Biomarkers

Affiliations

Mitochondrial Dysfunction in Peripheral Blood Mononuclear Cells as Novel Diagnostic Tools for Non-Alcoholic Fatty Liver Disease: Visualizing Relationships with Known and Potential Disease Biomarkers

Emirena Garrafa et al. Diagnostics (Basel). .

Abstract

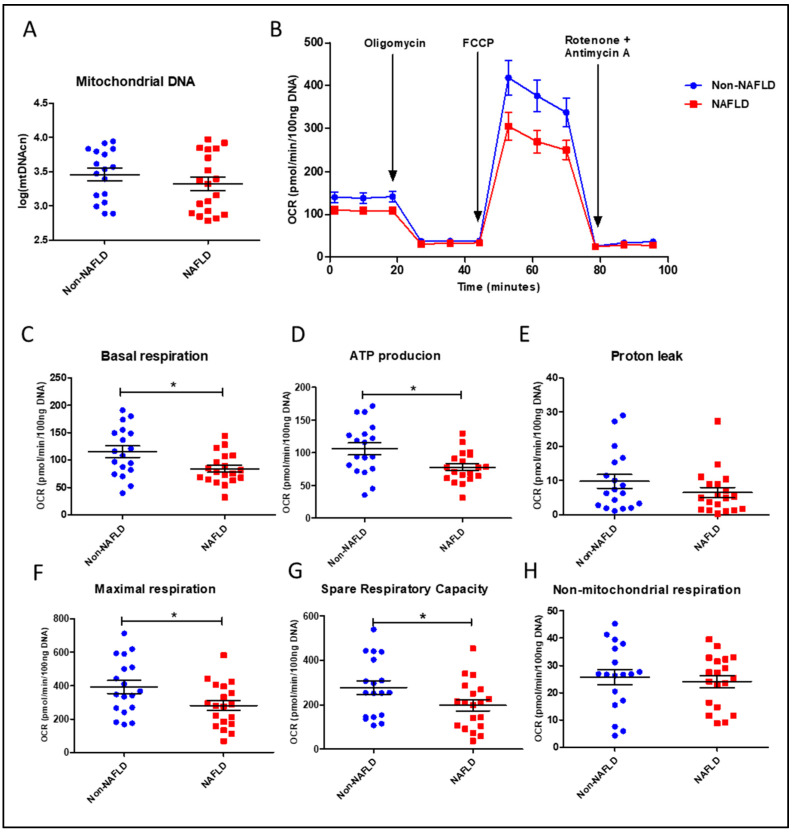
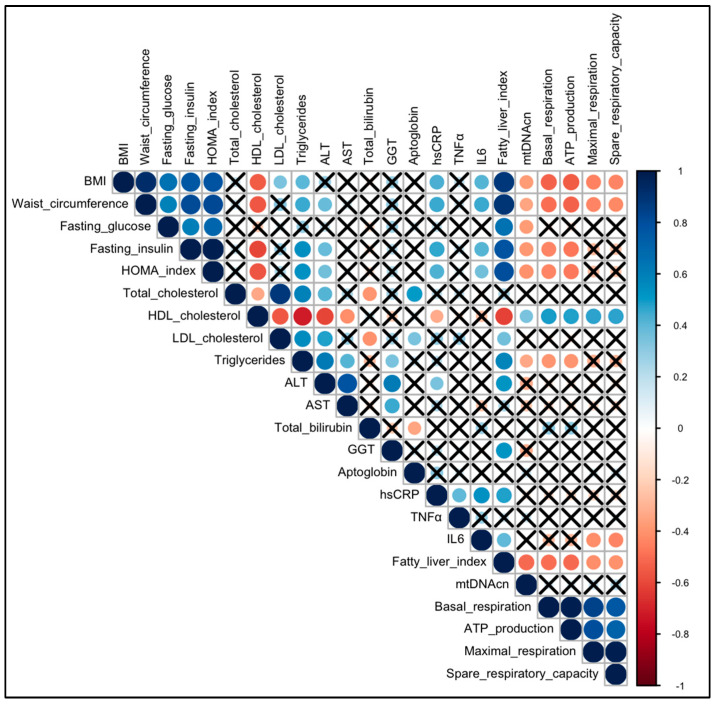
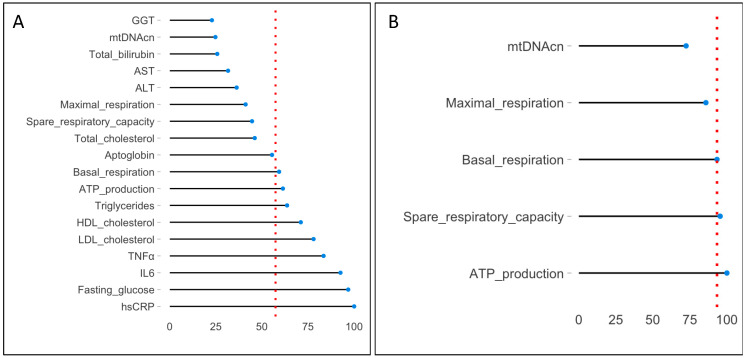
Non-alcoholic fatty liver disease (NAFLD) is a health emergency worldwide due to its high prevalence and the lack of specific therapies. Noninvasive biomarkers supporting NAFLD diagnosis are urgently needed. Liver mitochondrial dysfunction is a central NAFLD pathomechanism that changes throughout disease progression. Blood-cell bioenergetics reflecting mitochondrial organ dysfunction is emerging for its potential applications in diagnostics. We measured real-time mitochondrial respirometry in peripheral blood mononuclear cells (PBMCs), anthropometric parameters, routine blood analytes, and circulating cytokines from a cohort of NAFLD patients (N = 19) and non-NAFLD control subjects (N = 18). PBMC basal respiration, ATP-linked respiration, maximal respiration, and spare respiratory capacity were significantly reduced in NAFLD compared to non-NAFLD cases. Correlation plots were applied to visualize relationships between known or potential NAFLD-related biomarkers, while non-parametric methods were applied to identify which biomarkers are NAFLD predictors. Basal and ATP-linked mitochondrial respiration were negatively correlated with triglycerides and fasting insulin levels and HOMA index. Maximal and spare respiratory capacity were negatively correlated with IL-6 levels. All the mitochondrial respiratory parameters were positively correlated with HDL-cholesterol level and negatively correlated with fatty liver index. We propose including blood cell respirometry in panels of NAFLD diagnostic biomarkers to monitor disease progression and the response to current and novel therapies, including mitochondrial-targeted ones.

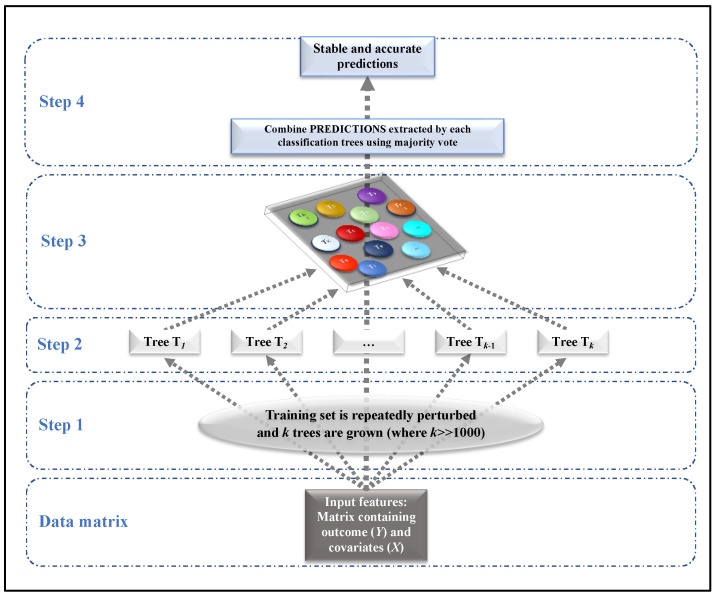
Keywords: correlation plot; mitochondrial bioenergetics; non-alcoholic fatty liver disease; peripheral blood mononuclear cells; random forest; relative variable importance.


Conflict of interest statement

The authors declare no conflict of interest. The funders had no role in the design of the study; in the collection, analyses, or interpretation of data; in the writing of the manuscript, or in the decision to publish the results.

Figures

Figure 1
Figure 1
Steps involved in Random Forest (case of classification).
Figure 2
Figure 2
Mitochondrial content and function in PBMCs from NAFLD patients and non-NAFLD controls. (A) Quantification of mitochondrial DNA copy number (mtDNAcn) with log-transformed values. (B) Time-course representation of oxygen consumption rate (OCR) measured in live PBMCs during the Mito Stress Test. Three measurements at different times were performed for each condition by the Seahorse XFe24 analyzer. OCR values were normalized to DNA content. (CH) Scatter dot plots of OCR values from individual subjects, normalized to DNA content, for each respiratory parameter. Data represent mean ± SEM. Statistical analysis has been performed with Wilcoxon Rank Sum Test. In scatter dot plots, * corresponds to p-value < 0.05. Statistical analysis was performed using GraphPad Prism 8.0.1 (San Diego, CA, USA).
Figure 3
Figure 3
Correlation plot for quantitative variables collected in this study. This correlation plot visualizes all the Spearman correlations (ρs) between couples of quantitative variables collected in this study. Blue and red circles correspond to positive (0 ρs 1) and negative correlations (1ρs< 0), respectively. The diameter and the color intensity of the circle is proportional to the magnitude of the Spearman index, and the black cross identifies it as not a significant correlation (correlation test p-values > 0.05). ALT, alanine aminotransferase; AST, aspartate aminotransferase; BMI, Body Mass Index; GGT, gamma-glutamyl transferase; HOMA index, homeostasis model assessment index; hsCRP, high-sensitivity C-reactive protein; IL6, interleukin-6; mtDNAcn, mitochondrial DNA copy number; TNFα, tumor necrosis factor-α.
Figure 4
Figure 4
VIMrel extracted from two Random Forest models. The VIMrel is an interesting tool provided by Random Forest which assigns a percentage (from a minimum of 0% to a maximum of 100%) to each covariate in the model. The lollipop graph reports these percentages on the x-axis and the predictors (variables) on the y-axis. Variables are reordered in ascending importance in predicting the diagnosis (the least important at the top of the graph, the most important, with a VIMrel = 100%, at the bottom of the graph). The dashed red line is the median (VIMrel), which represents the cut-off point for making variable selection. (A) shows the VIMrel of the first model involving biochemical and mitochondrial variables. The cut-off point for variable selection is 57.36%, and covariates that exceeded (or are equal to) this threshold are hsCRP, fasting glucose, IL-6, TNF-α, LDL cholesterol, HDL cholesterol, triglycerides, ATP production, and basal respiration. (B) shows the VIMrel of the second model involving only mitochondrial variables. Here, the cut-off point for variable selection is 93.32%, and covariates that exceeded (or are equal to) this threshold are ATP production, spare respiratory capacity, and basal respiration. Abbreviations are like those in the legend to Figure 3.

Similar articles

Cited by

References

    1. Powell E.E., Wong V.W.S., Rinella M. Non-Alcoholic Fatty Liver Disease. Lancet. 2021;397:2212–2224. doi: 10.1016/S0140-6736(20)32511-3. - DOI - PubMed
    1. European Association for the Study of the Liver (EASL) European Association for the Study of Diabetes (EASD) European Association for the Study of Obesity (EASO) EASL–EASD–EASO Clinical Practice Guidelines for the Management of Non-Alcoholic Fatty Liver Disease. J. Hepatol. 2016;64:1388–1402. doi: 10.1016/j.jhep.2015.11.004. - DOI - PubMed
    1. Chowdhury A.B., Mehta K.J. Liver Biopsy for Assessment of Chronic Liver Diseases: A Synopsis. Clin. Exp. Med. 2023;23:273–285. doi: 10.1007/s10238-022-00799-z. - DOI - PMC - PubMed
    1. Tilg H., Effenberger M. From NAFLD to MAFLD: When Pathophysiology Succeeds. Nat. Rev. Gastroenterol. Hepatol. 2020;17:387–388. doi: 10.1038/s41575-020-0316-6. - DOI - PubMed
    1. Angulo P., Hui J.M., Marchesini G., Bugianesi E., George J., Farrell G.C., Enders F., Saksena S., Burt A.D., Bida J.P., et al. The NAFLD Fibrosis Score: A Noninvasive System That Identifies Liver Fibrosis in Patients with NAFLD. Hepatology. 2007;45:846–854. doi: 10.1002/hep.21496. - DOI - PubMed

LinkOut - more resources