

Haplotype-Resolution Transcriptome Analysis Reveals Important Responsive Gene Modules and Allele-Specific Expression Contributions under Continuous Salt and Drought in Camellia sinensis
- PMID: 37510320
- PMCID: PMC10379978
- DOI: 10.3390/genes14071417
Haplotype-Resolution Transcriptome Analysis Reveals Important Responsive Gene Modules and Allele-Specific Expression Contributions under Continuous Salt and Drought in Camellia sinensis
Abstract
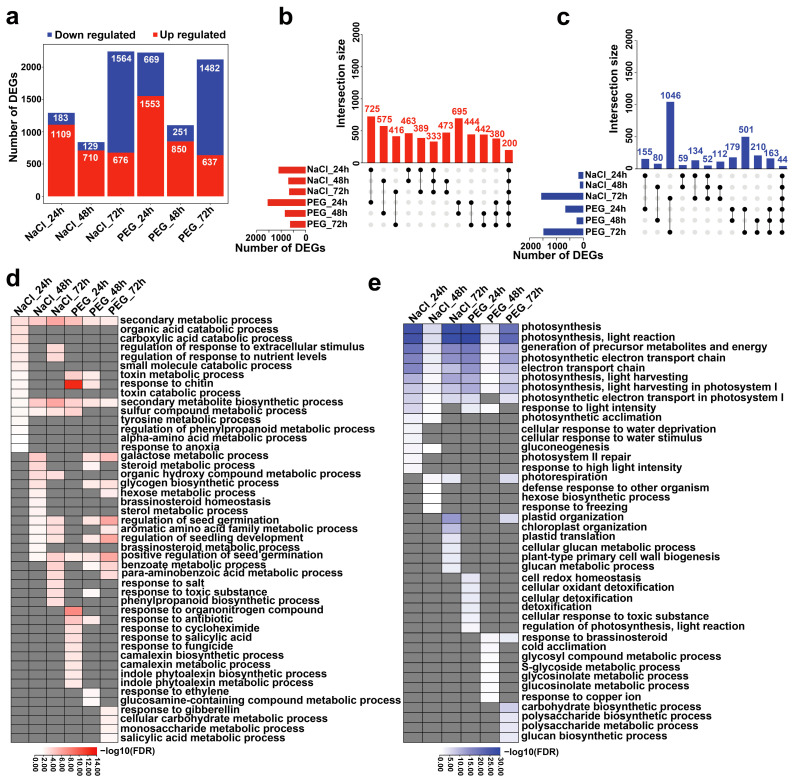
The tea plant, Camellia sinensis (L.) O. Kuntze, is one of the most important beverage crops with significant economic and cultural value. Global climate change and population growth have led to increased salt and drought stress, negatively affecting tea yield and quality. The response mechanism of tea plants to these stresses remains poorly understood due to the lack of reference genome-based transcriptional descriptions. This study presents a high-quality genome-based transcriptome dynamic analysis of C. sinensis' response to salt and drought stress. A total of 2244 upregulated and 2164 downregulated genes were identified under salt and drought stress compared to the control sample. Most of the differentially expression genes (DEGs) were found to involve divergent regulation processes at different time points under stress. Some shared up- and downregulated DEGs related to secondary metabolic and photosynthetic processes, respectively. Weighted gene co-expression network analysis (WGCNA) revealed six co-expression modules significantly positively correlated with C. sinensis' response to salt or drought stress. The MEpurple module indicated crosstalk between the two stresses related to ubiquitination and the phenylpropanoid metabolic regulation process. We identified 1969 salt-responsive and 1887 drought-responsive allele-specific expression (ASE) genes in C. sinensis. Further comparison between these ASE genes and tea plant heterosis-related genes suggests that heterosis likely contributes to the adversity and stress resistance of C. sinensis. This work offers new insight into the underlying mechanisms of C. sinensis' response to salt and drought stress and supports the improved breeding of tea plants with enhanced salt and drought tolerance.
Keywords: Camellia sinensis; allele-specific expression; co-expression network; salt and drought stress; transcriptome.
Conflict of interest statement
The authors declare no conflict of interest.
Figures


Similar articles
-
A method for mining condition-specific co-expressed genes in Camellia sinensis based on k-means clustering.BMC Plant Biol. 2024 May 8;24(1):373. doi: 10.1186/s12870-024-05086-5. BMC Plant Biol. 2024. PMID: 38714965 Free PMC article.
-
Identification of drought-responsive miRNAs and physiological characterization of tea plant (Camellia sinensis L.) under drought stress.BMC Plant Biol. 2017 Nov 21;17(1):211. doi: 10.1186/s12870-017-1172-6. BMC Plant Biol. 2017. PMID: 29157225 Free PMC article.
-
A shared response of thaumatin like protein, chitinase, and late embryogenesis abundant protein3 to environmental stresses in tea [Camellia sinensis (L.) O. Kuntze].Funct Integr Genomics. 2012 Aug;12(3):565-71. doi: 10.1007/s10142-012-0279-y. Epub 2012 Apr 29. Funct Integr Genomics. 2012. PMID: 22543414
-
Advances in the knowledge of adaptive mechanisms mediating abiotic stress responses in Camellia sinensis.Front Biosci (Landmark Ed). 2021 Dec 30;26(12):1714-1722. doi: 10.52586/5063. Front Biosci (Landmark Ed). 2021. PMID: 34994184 Review.
-
Proteomics and phosphoproteomics reveal the different drought-responsive mechanisms of priming with (Z)-3-hexenyl acetate in two tea cultivars.J Proteomics. 2023 Oct 30;289:105010. doi: 10.1016/j.jprot.2023.105010. Epub 2023 Oct 4. J Proteomics. 2023. PMID: 37797878 Review.
Cited by
-
Integrative Analysis of Transcriptomic and Metabolomic Profiles Uncovers the Mechanism of Color Variation in the Tea Plant Callus.Plants (Basel). 2025 May 13;14(10):1454. doi: 10.3390/plants14101454. Plants (Basel). 2025. PMID: 40431018 Free PMC article.
References
-
- FAO . How to Feed the World in 2050, High-Level Expert Forum. Food and Agriculture Organization of the United Nations; Rome, Italy: 2009. pp. 35–35.
Publication types
MeSH terms
Substances
LinkOut - more resources
Full Text Sources
