

Pressure Overload and Right Ventricular Failure: From Pathophysiology to Treatment
- PMID: 37510837
- PMCID: PMC10380537
- DOI: 10.3390/jcm12144722
Pressure Overload and Right Ventricular Failure: From Pathophysiology to Treatment
Abstract
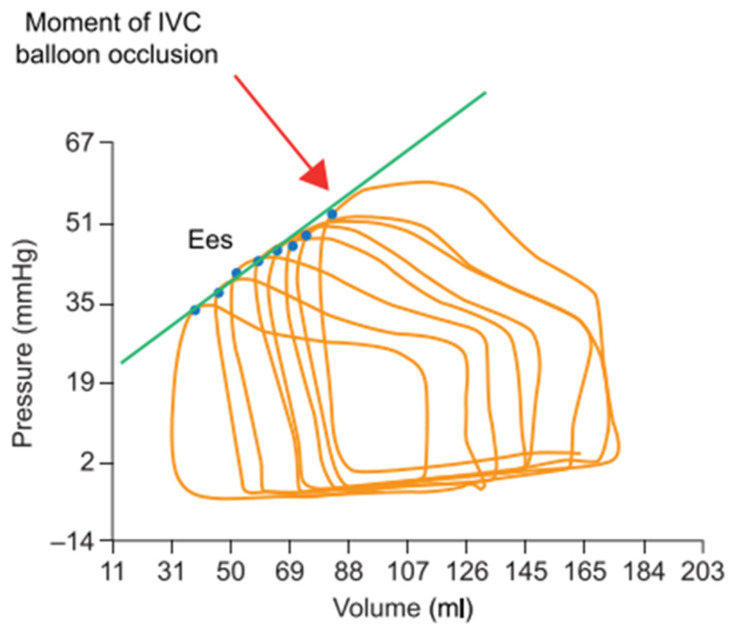
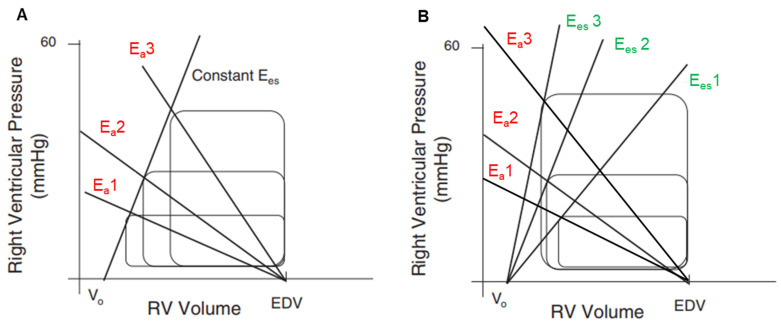
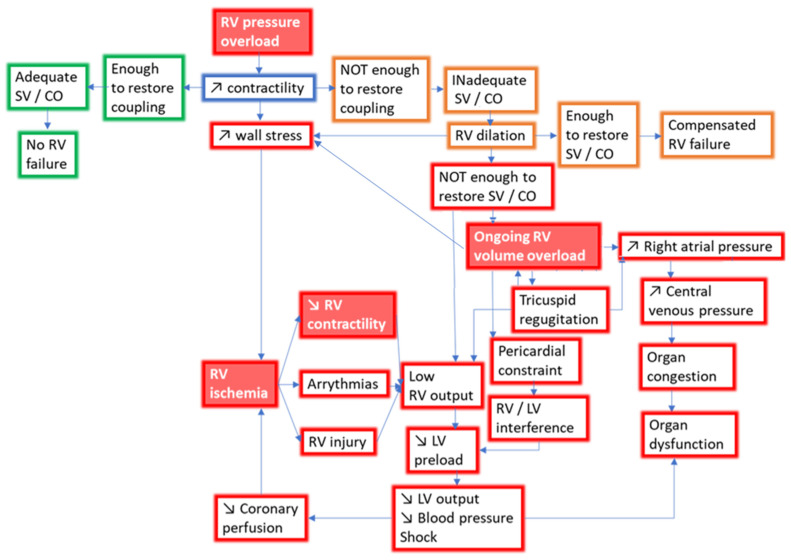
Right ventricular failure (RVF) is often caused by increased afterload and disrupted coupling between the right ventricle (RV) and the pulmonary arteries (PAs). After a phase of adaptive hypertrophy, pressure-overloaded RVs evolve towards maladaptive hypertrophy and finally ventricular dilatation, with reduced stroke volume and systemic congestion. In this article, we review the concept of RV-PA coupling, which depicts the interaction between RV contractility and afterload, as well as the invasive and non-invasive techniques for its assessment. The current principles of RVF management based on pathophysiology and underlying etiology are subsequently discussed. Treatment strategies remain a challenge and range from fluid management and afterload reduction in moderate RVF to vasopressor therapy, inotropic support and, occasionally, mechanical circulatory support in severe RVF.
Keywords: adaptive hypertrophy; echocardiography; hemodynamics; maladaptive hypertrophy; pressure–volume loops; right heart failure; right ventricular failure; right ventricular–pulmonary artery coupling; therapy.
Conflict of interest statement
The authors declare no conflict of interest.
Figures
Similar articles
-
Acute right ventricular failure--from pathophysiology to new treatments.Intensive Care Med. 2004 Feb;30(2):185-196. doi: 10.1007/s00134-003-2025-3. Epub 2003 Nov 15. Intensive Care Med. 2004. PMID: 14618229 Review.
-
The Dark Side of the Moon: The Right Ventricle.J Cardiovasc Dev Dis. 2017 Oct 20;4(4):18. doi: 10.3390/jcdd4040018. J Cardiovasc Dev Dis. 2017. PMID: 29367547 Free PMC article. Review.
-
Contemporary treatment of right ventricular failure.JHLT Open. 2024 Dec 30;7:100203. doi: 10.1016/j.jhlto.2024.100203. eCollection 2025 Feb. JHLT Open. 2024. PMID: 40144829 Free PMC article. Review.
-
Treatment of right ventricular dysfunction and heart failure in pulmonary arterial hypertension.Cardiovasc Diagn Ther. 2020 Oct;10(5):1659-1674. doi: 10.21037/cdt-20-348. Cardiovasc Diagn Ther. 2020. PMID: 33224779 Free PMC article. Review.
-
Pulmonary vascular collagen content, not cross-linking, contributes to right ventricular pulsatile afterload and overload in early pulmonary hypertension.J Appl Physiol (1985). 2017 Feb 1;122(2):253-263. doi: 10.1152/japplphysiol.00325.2016. Epub 2016 Nov 17. J Appl Physiol (1985). 2017. PMID: 27856711 Free PMC article.
Cited by
-
Early Outcomes of Right Ventricular Pressure and Volume Overload in an Ovine Model.Biology (Basel). 2025 Feb 7;14(2):170. doi: 10.3390/biology14020170. Biology (Basel). 2025. PMID: 40001938 Free PMC article.
-
Myocardial Matrix Hydrogels Mitigate Negative Remodeling and Improve Function in Right Heart Failure Model.JACC Basic Transl Sci. 2024 Mar 6;9(3):322-338. doi: 10.1016/j.jacbts.2024.01.006. eCollection 2024 Mar. JACC Basic Transl Sci. 2024. PMID: 38559631 Free PMC article.
-
Percutaneous mechanical circulatory support for acute right heart failure: A practical approach.ESC Heart Fail. 2025 Aug;12(4):2652-2668. doi: 10.1002/ehf2.15305. Epub 2025 Apr 20. ESC Heart Fail. 2025. PMID: 40254772 Free PMC article. Review.
-
Molecular Pathophysiology of Chronic Thromboembolic Pulmonary Hypertension: A Clinical Update from a Basic Research Perspective.Adv Respir Med. 2024 Nov 27;92(6):485-503. doi: 10.3390/arm92060044. Adv Respir Med. 2024. PMID: 39727495 Free PMC article. Review.
References
-
- Starr I., Jeffers W.A., Meade R.H. The Absence of Conspicuous Increments of Venous Pressure after Severe Damage to the Right Ventricle of the Dog, with a Discussion of the Relation between Clinical Congestive Failure and Heart Disease. Am. Heart J. 1943;26:291–301. doi: 10.1016/S0002-8703(43)90325-4. - DOI
-
- Downing T.E., Allen K.Y., Glatz A.C., Rogers L.S., Ravishankar C., Rychik J., Faerber J.A., Fuller S., Montenegro L.M., Steven J.M., et al. Long-Term Survival after the Fontan Operation: Twenty Years of Experience at a Single Center. J. Thorac. Cardiovasc. Surg. 2017;154:243–253.e2. doi: 10.1016/j.jtcvs.2017.01.056. - DOI - PubMed
-
- La Gerche A., MacIsaac A.I., Burns A.T., Mooney D.J., Inder W.J., Voigt J.-U., Heidbüchel H., Prior D.L. Pulmonary Transit of Agitated Contrast Is Associated with Enhanced Pulmonary Vascular Reserve and Right Ventricular Function during Exercise. J. Appl. Physiol. 2010;109:1307–1317. doi: 10.1152/japplphysiol.00457.2010. - DOI - PubMed
Publication types
LinkOut - more resources
Full Text Sources
