. 2023 Jul 13;24(14):11416.
doi: 10.3390/ijms241411416.

Thrombin-Induced Microglia Activation Modulated through Aryl Hydrocarbon Receptors

Affiliations

Thrombin-Induced Microglia Activation Modulated through Aryl Hydrocarbon Receptors

Meei-Ling Sheu et al. Int J Mol Sci. .

Abstract

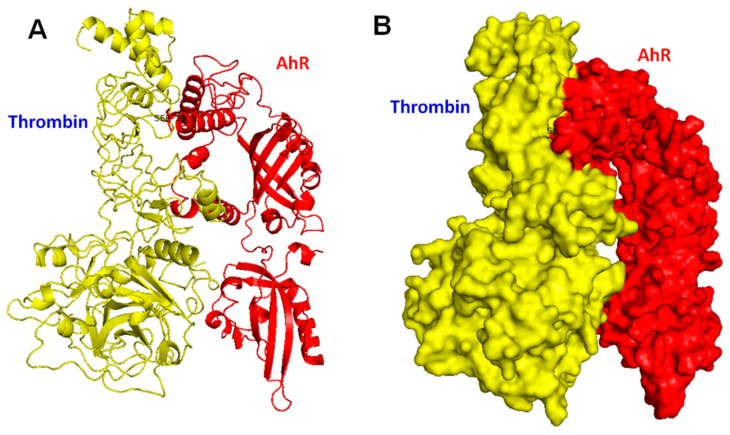
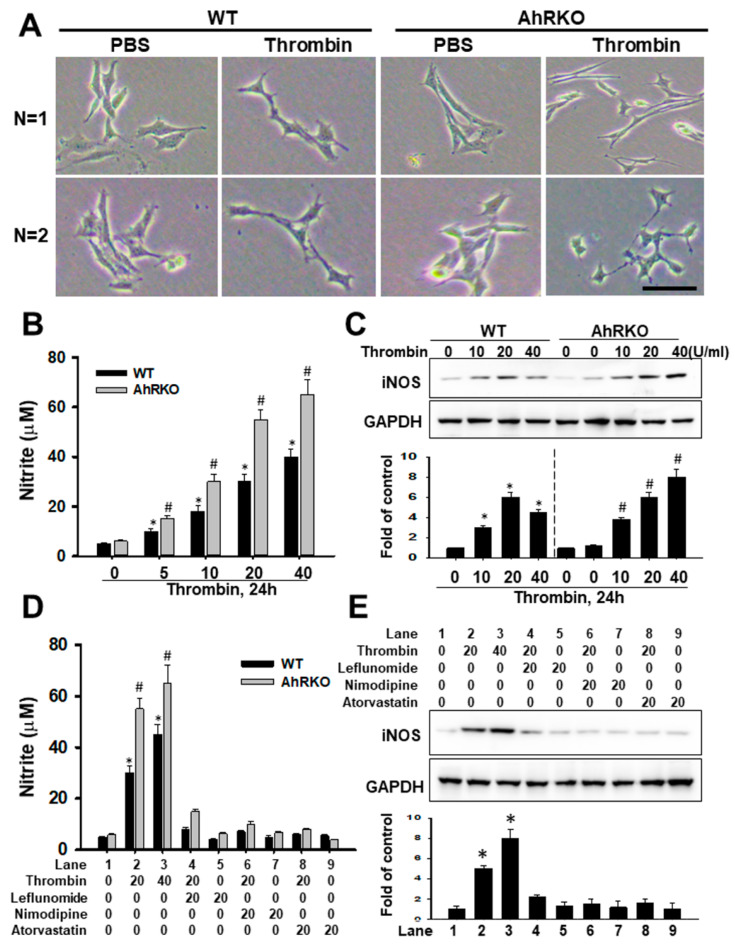
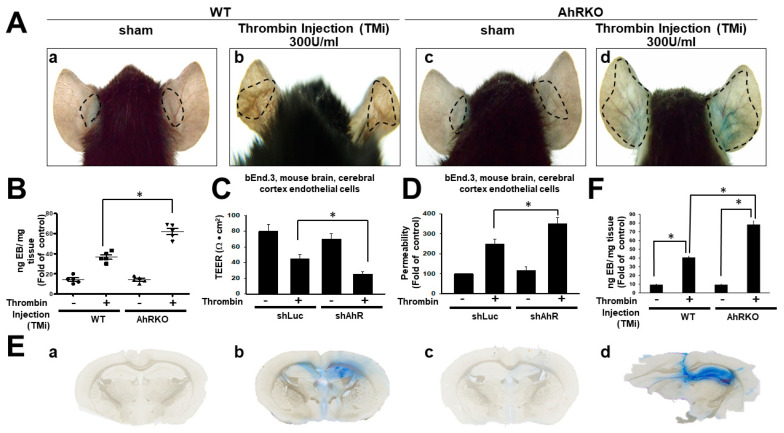
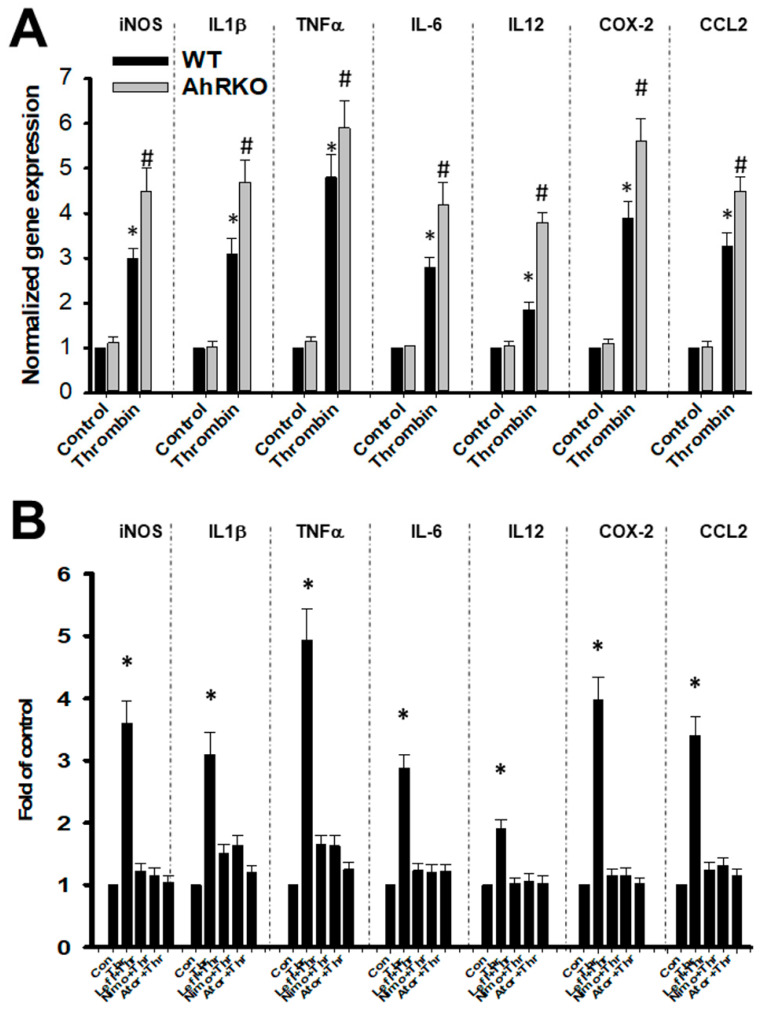
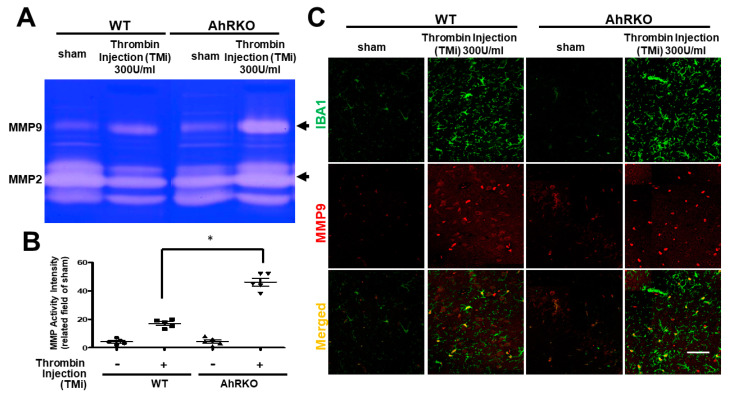
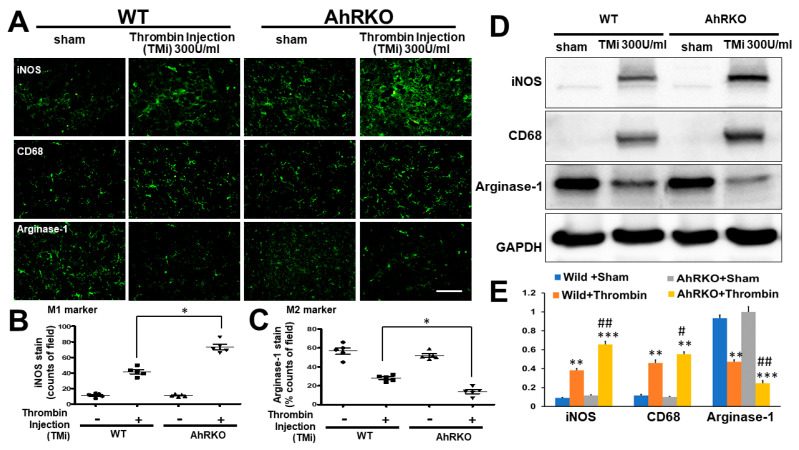
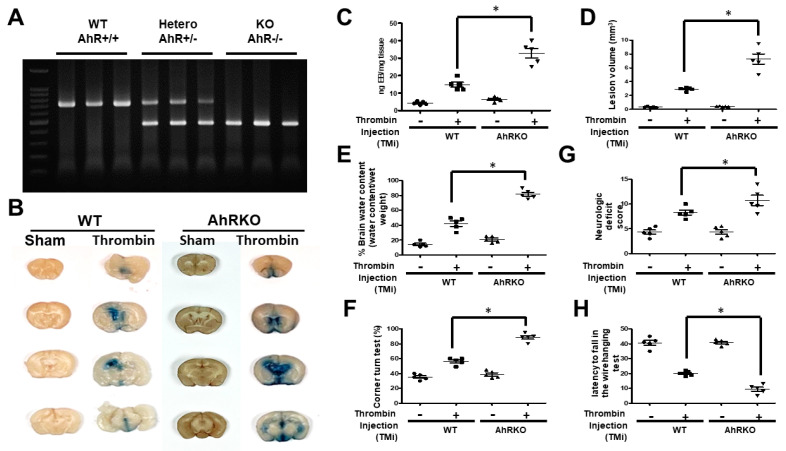
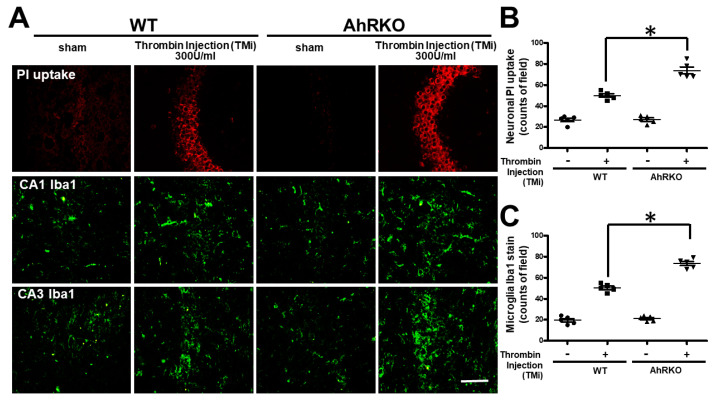
Thrombin is a multifunctional serine protein which is closely related to neurodegenerative disorders. The Aryl hydrocarbon receptor (AhR) is well expressed in microglia cells involving inflammatory disorders of the brain. However, it remains unclear as to how modulation of AhR expression by thrombin is related to the development of neurodegeneration disorders. In this study, we investigated the role of AhR in the development of thrombin-induced neurodegenerative processes, especially those concerning microglia. The primary culture of either wild type or AhR deleted microglia, as well as BV-2 cell lines, was used for an in vitro study. Hippocampal slice culture and animals with either wild type or with AhR deleted were used for the ex vivo and in vivo studies. Simulations of ligand protein docking showed a strong integration between the thrombin and AhR. In thrombin-triggered microglia cells, deleting AhR escalated both the NO release and iNOS expression. Such effects were abolished by the administration of the AhR agonist. In thrombin-activated microglia cells, downregulating AhR increased the following: vascular permeability, pro-inflammatory genetic expression, MMP-9 activity, and the ratio of M1/M2 phenotype. In the in vivo study, thrombin induced the activation of microglia and their volume, thereby contributing to the deterioration of neurobehavior. Deleting AhR furthermore aggravated the response in terms of impaired neurobehavior, increasing brain edema, aggregating microglia, and increasing neuronal death. In conclusion, thrombin caused the activation of microglia through increased vessel permeability, expression of inflammatory response, and phenotype of M1 microglia, as well the MMP activity. Deleting AhR augmented the above detrimental effects. These findings indicate that the modulation of AhR is essential for the regulation of thrombin-induced brain damages and that the AhR agonist may harbor the potentially therapeutic effect in thrombin-induced neurodegenerative disorder.

Keywords: aryl hydrocarbon receptor; inflammation; microglia; neurodegenerative disorder; thrombin.


Conflict of interest statement

The authors declare no conflict of interest.

Figures

Figure 1
Figure 1
Molecular docking interactions of thrombin at the binding site of AhR (Ser 36) protein. The docking algorithm was tested based on both bound and unbound cases as in the ZDOCK benchmark 2.0 dataset. (A) The molecular structure of human AhR is depicted as a ribbon diagram, showing α-helices, β-pleated sheets, and loops. The binding site between thrombin (yellow) and AhR (red) is targeted at Ser 36. The 3D representation of interactions between thrombin and the AhR active site (Ser 36) is generated with the PyMOL(TM) 1.7.4.5.edu. (B) Configuration showing the surface representation of the thrombin (yellow) directly targeting AhR (Ser 36). Thrombin (yellow) and AhR (red) are shown in surface representation.
Figure 2
Figure 2
Thrombin-activated microglia cells: release of NO and iNO manipulated by AhR gene knockout and AhR agonist. (A) The light photography showed the representative morphology of primary microglia culture either from wild or AhR (−/−) mice subjected to PBS or thrombin stimulation in two respective experiments (N = 1, and 2). (B) Microglial cells were incubated for 24 h with the indicated amount of thrombin (U/mL). The amount of nitrite formed from NO was determined as described in Methods. Each value represents the Mean ± SEM of three samples. (C) iNO expression was detected by immunoblotting. Cells were treated with 5–40 U/mL of thrombin for the indicated times. Results of quantitative analysis in immunoblotting are shown. (D) Microglia were treated with 20 U/mL of thrombin for 14 h in the absence or presence of 20 μM leflunomide (Lef), Nimodipine (Nim), or Atorvastatin (Ator). The amount of nitrite formed from NO was determined. Each value is the mean ± SEM of three samples. *: p < 0.05, indicating a significant difference between experimental and control groups; #: p < 0.05 indicating a significant difference between wild type and AhRKO groups. (E) For immunoblotting analysis, cells were treated with 20–40 U/mL of thrombin for 24 h in the absence or presence of Lef, Nim, or Ator. Results of the quantitative analysis in immunoblotting are shown *: p < 0.05 indicated a difference in iNOS expression treated with Lef, Nim, and Ator against treatment with 20 U of thrombin. Bar length = 100 μm.
Figure 3
Figure 3
Aryl hydrocarbon receptor deficiency (AhRKO) induced vascular permeability in vitro and increased vascular leakage in thrombin-induced brain injury animals. (A) The Miles assay was used to test vascular permeability in vivo by photoimaging vascular leakage in both ears of mice, with subcutaneous regions under various conditions as indicated. (A) Leakage of the dye to adjacent tissue was found after treatment with thrombin injection (TMi) 300 U/mL. (B) Showing quantified results of vascular permeability, with normalized values relative to the thrombin group and relative changes (Evans’s blue (EB)/mg tissue). Data are presented as mean ± SEM of five independent experiments. * p < 0.05 compared with the TMi group. (C) Transepithelial/endothelial electrical resistance (TEER) was used to detect barrier tissue integrity in vitro. Endothelial cells of cerebral cortex of mouse (bEND.3) were seeded on transwell inserts for measurement of maximal electric resistance, and were then incubated with thrombin (20 U/mL) until day 4. Transendothelial electrical resistance (TEER, Ω·cm2) was monitored using a Millicell-ERS2 Volt-Ohm Meter. (D) Cell membrane permeability test. The bEND.3 cells were pretreated with thrombin (20 U/mL). At the end of the treatments, fluorescein isothiocyanate–dextran (FD40, final concentration 1 mg/mL) was added to the cells compartment. Monolayer hyperpermeability was assessed fluorometrically at 485/520 nm, with results showing values normalized relative to the thrombin group and relative arbitrary changes. (E) Showing quantified results of vascular permeability, with normalized values relative to the thrombin group and relative changes (Evans’s blue (EB)/mg tissue). Data are presented as mean ± SEM of three independent experiments. (F) Leakage of the dye to the hippocampus was found after treatment with thrombin injection (TMi) 300 U/mL either in wild or AhRKO mice. a: sham (wild type); b: thrombin injection (TMi) 300 U/mL either in wild type animal; c: sham (AhRKO); d: thrombin injection (TMi) 300 U/mL either in AhRKO animal. * p < 0.05 compared with the TMi group.
Figure 4
Figure 4
Pro-inflammatory gene expressions in thrombin-triggered microglia were influenced by AhR deletion or AhR agonists. (A) Primary microglia cells in either wild type or AhR deleted condition were first treated with thrombin for 12 h, and then their pro-inflammatory cytokines were quantified by qRT-PCR. The pro-inflammatory cytokines studied were iNOS, IL1β, TNF-α, IL-6, IL12, PGE2, and CCL2. AhR deleted microglia showed a significant induction in all pro-inflammatory cytokines’ gene expressions compared with WT microglia. (B) These pro-inflammatory gene expressions in thrombin-induced microglia cells were counteracted by AhR agonists. Primary microglia cells were either treated without (control) or with thrombin 20 U/mL for 12 h with the addition of either leflunomide, nimodipine, or atorvastatin, and then their gene expressions (as specified above) were quantified by qRT-PCR. These thrombin-induced cytokine expressions were attenuated by AhR agonists such as leflunomide, nimodipine, or atorvastatin (values shown are mean and SEM; Student’s t test; n = 6). *: p < 0.05 indicated the statistical significance between the thrombin and control group in wild type microglia cells.; #: p < 0.05; indicated the statistical significance between wild and AhRKO group after thrombin treatment.
Figure 5
Figure 5
Aryl hydrocarbon receptor deficiency (AhRKO) after thrombin injection in vivo increased MMP9 activity, but not MMP2. AhRKO mice following TMi increased MMP9 activity at 72 h (n = 5, * p < 0.05, vs. thrombin vehicle; one-way ANOVA with Fisher’s least significant difference test). (A) Presentation of MMP 9 activity. (B) Quantification of MMP 9 activity (n = 5, * p < 0.05 vs. thrombin group). M2 marker Arginase-1 staining results (n = 5, * p < 0.05 vs. thrombin group). (C) Representative images of brain sections at 72 h after thrombin injection, showing double staining with both microglia cell marker Iba1 (green) and MMP 9 (red). Scale bars: 50 μm. Data shown are mean ± SEM.
Figure 6
Figure 6
AhR deletion increased the ratio of M1/M2 markers in microglia after thrombin injection in vivo. (A) Representative images showing iNOS (M1 marker), microglia marker (IBA-1), and Arginase-1 (M2 marker) in both wild type and AhR-deleted mice three days after thrombin injection (300 U/mL). (B) Quantified results of staining with M1 marker iNOSing. (n = 5, * p < 0.05 vs. thrombin group). (C) Quantified results of staining with M2 marker (Arginase-1) (n = 5, * p < 0.05 vs. thrombin group). (D) The representative western blot analysis in hippocampus in iNOS, CD 68, and Arginase 1 (GAPDH as an internal control). (E) Quantified results of western blot of iNOS, CD 68, and Arginase relative to GAPDH. ** p < 0.01 and *** p < 0.001 indicated the experimental group relative to sham. # p < 0.05 and ## p < 0.01 indicated the group of AhRKO relative to wild type after thrombin injection. Scale bars: 50 μm. Data shown are mean ± SEM.
Figure 7
Figure 7
Thrombin injection (TMi) increased lesion volume and impaired neurobehavior, and these responses were further aggravated with aryl hydrocarbon receptor deficiency (AhRKO). (A) Results of polymerase chain reaction for AhR genotyping in wild type, AhR +/−, and AhR +/+. (B) The representative of photography in Evan blue injection in consecutive of brain slice in coronal view. (C) Quantitative data of lesion size measured by the amount of Evan blue in ng. (D) Quantified data of lesion volume measured in mm3. The volume was calculated by the thickness of a brain slice multiplying the summed surface area of Evan’s blue after thrombin injection derived from contiguous coronal sections. AhR-deleted mice after TMi at 72 h showing the increased lesion volume compared with the wild type (n = 5, * p < 0.05, vs. thrombin vehicle; one-way ANOVA with Fisher’s least significant difference test at each time point). (E) AhR deletion aggravated striatal edema at 72 h after thrombin injection compared with the wild type (n = 5, * p < 0.05 vs. thrombin; Fisher’s least significant difference test). (F) AhR deletion impaired corner turn test performance of mice at 72 h after thrombin injection compared with the wild type (n = 5, p < 0.05 vs. thrombin; one-way ANOVA with Fisher’s least significant difference test at each time point). (G) AhR deletion significantly increased neurologic deficit scores over the wild type at 72 h after thrombin injection. (n = 5, * p < 0.05, t-test at each time point). (H) Wild type mice receiving thrombin injection showed shorter fall latency in the wire hanging test at 72 h after injection, and AhR deletion furthermore led to a longer fall latency. The difference was statistically significant (n = 5, * p < 0.05 vs. sham; two-way ANOVA with Fisher’s least significant difference test). Values are mean ± SEM.
Figure 8
Figure 8
Aggravation of neuronal survival occurred concurrently with activated microglia in organotypic hippocampal slice cultures with hydrocarbon receptor deficiency. (A) Neuronal injury at the hippocampal CA1 and CA3 regions is represented by the intensity of PI fluorescence (red), and microglia activation is represented with microglia Iba1 staining labeled with FITC (green). Representative images of hippocampus after TMi injection were allocated to saline (sham) and 300 U/mL thrombin either in the wild type or AhR deleted slice culture. (B) Quantified results of neuronal PI fluorescence uptake (count/field). Hippocampal injury was generated by injection of thrombin and observed later at 72 h. AhR deletion aggravated hippocampal injury as induced by Thrombin injection (TMi) 300 U/mL when compared with the wild type at 72 h (n = 5, * p < 0.05 vs. Thrombin group; Fisher’s least significant difference test). PI: propidium iodide (red). (C) Hippocampal injury is quantified by the intensity of microglia Iba1 staining (count/field) in the fluorescence FITC images of the hippocampal slices, after exposing to thrombin as indicated for 72 h (n = 5, * p < 0.05 vs. Thrombin group; Fisher’s least significant difference test). Scale bar: 500 μm. Data are mean ± SEM.
Figure 9
Figure 9
Aryl hydrocarbon receptor deficiency (AhRKO) induced cell death after thrombin injection in vivo. (A) Images of brain sections at 72 h after thrombin injection, showing DNA oxidative damages as indicated by 8-oxo-dG staining, neuronal degeneration by Fluoro-Jade B (FJB)-staining, and DNA fragmentation by terminal deoxynucleotidyl transferase dUTP nick end labeling (TUNEL) (red color) and neuron (green color). (B) Quantified data on 8-oxo-dG-stained cells (n = 5, * p < 0.05 vs. thrombin group). (C) Quantified results of Fluoro-Jade B (FJB)-staining (n = 5, * p < 0.05 vs. thrombin group). Scale bars: 50 mm. Data are mean ± SEM.

References

    1. Krause D.L., Müller N. Neuroinflammation, microglia and implications for anti-inflammatory treatment in Alzheimer’s disease. Int. J. Alzheimer’s Dis. 2010;2010:732806. doi: 10.4061/2010/732806. - DOI - PMC - PubMed
    1. Bamberger M.E., Landreth G.E. Inflammation, apoptosis, and Alzheimer’s disease. Neurosci. A Rev. J. Bringing Neurobiol. Neurol. Psychiatry. 2002;8:276–283. doi: 10.1177/1073858402008003013. - DOI - PubMed
    1. Dheen S.T., Kaur C., Ling E.A. Microglial activation and its implications in the brain diseases. Curr. Med. Chem. 2007;14:1189–1197. doi: 10.2174/092986707780597961. - DOI - PubMed
    1. Lull M.E., Block M.L. Microglial activation and chronic neurodegeneration. Neurother. J. Am. Soc. Exp. NeuroTher. 2010;7:354–365. doi: 10.1016/j.nurt.2010.05.014. - DOI - PMC - PubMed
    1. Badruddoja M.A., Black K.L. Improving the delivery of therapeutic agents to CNS neoplasms: A clinical review. Front. Biosci. A J. Virtual Libr. 2006;11:1466–1478. doi: 10.2741/1896. - DOI - PubMed

LinkOut - more resources