

Equine Hoof Progenitor Cells Display Increased Mitochondrial Metabolism and Adaptive Potential to a Highly Pro-Inflammatory Microenvironment
- PMID: 37511204
- PMCID: PMC10379971
- DOI: 10.3390/ijms241411446
Equine Hoof Progenitor Cells Display Increased Mitochondrial Metabolism and Adaptive Potential to a Highly Pro-Inflammatory Microenvironment
Abstract
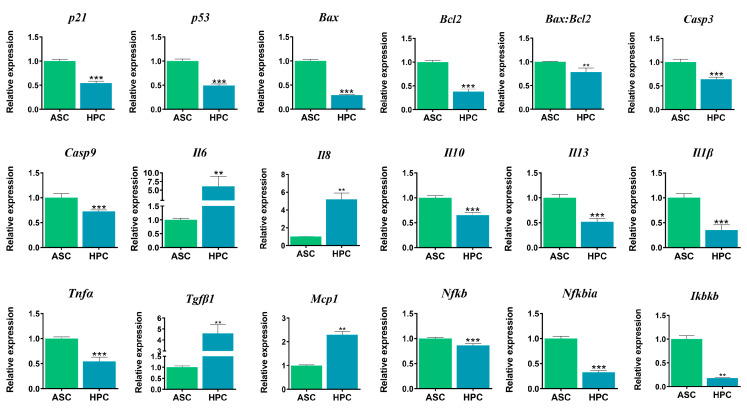
Medicinal signaling cells (MSC) exhibit distinct molecular signatures and biological abilities, depending on the type of tissue they originate from. Recently, we isolated and described a new population of stem cells residing in the coronary corium, equine hoof progenitor cells (HPCs), which could be a new promising cell pool for the treatment of laminitis. Therefore, this study aimed to compare native populations of HPCs to well-established adipose-derived stem cells (ASCs) in standard culture conditions and in a pro-inflammatory milieu to mimic a laminitis condition. ASCs and HPCs were either cultured in standard conditions or subjected to priming with a cytokines cocktail mixture. The cells were harvested and analyzed for expression of key markers for phenotype, mitochondrial metabolism, oxidative stress, apoptosis, and immunomodulation using RT-qPCR. The morphology and migration were assessed based on fluorescent staining. Microcapillary cytometry analyses were performed to assess the distribution in the cell cycle, mitochondrial membrane potential, and oxidative stress. Native HPCs exhibited a similar morphology to ASCs, but a different phenotype. The HPCs possessed lower migration capacity and distinct distribution across cell cycle phases. Native HPCs were characterized by different mitochondrial dynamics and oxidative stress levels. Under standard culture conditions, HPCs displayed different expression patterns of apoptotic and immunomodulatory markers than ASCs, as well as distinct miRNA expression. Interestingly, after priming with the cytokines cocktail mixture, HPCs exhibited different mitochondrial dynamics than ASCs; however, the apoptosis and immunomodulatory marker expression was similar in both populations. Native ASCs and HPCs exhibited different baseline expressions of markers involved in mitochondrial dynamics, the oxidative stress response, apoptosis and inflammation. When exposed to a pro-inflammatory microenvironment, ASCs and HPCs differed in the expression of mitochondrial condition markers and chosen miRNAs.
Keywords: ASC; adipose stem cells; equine; hoof; laminitis; progenitor cells; stem cells.
Conflict of interest statement
The authors declare no conflict of interest.
Figures


Similar articles
-
Equine Hoof Stem Progenitor Cells (HPC) CD29 + /Nestin + /K15 + - a Novel Dermal/epidermal Stem Cell Population With a Potential Critical Role for Laminitis Treatment.Stem Cell Rev Rep. 2021 Aug;17(4):1478-1485. doi: 10.1007/s12015-021-10187-x. Epub 2021 May 26. Stem Cell Rev Rep. 2021. PMID: 34037924 Free PMC article.
-
Age-dependent impairment of adipose-derived stem cells isolated from horses.Stem Cell Res Ther. 2020 Jan 3;11(1):4. doi: 10.1186/s13287-019-1512-6. Stem Cell Res Ther. 2020. PMID: 31900232 Free PMC article.
-
In Vitro Generated Equine Hepatic-Like Progenitor Cells as a Novel Potent Cell Pool for Equine Metabolic Syndrome (EMS) Treatment.Stem Cell Rev Rep. 2023 May;19(4):1124-1134. doi: 10.1007/s12015-023-10507-3. Epub 2023 Jan 20. Stem Cell Rev Rep. 2023. PMID: 36658383 Free PMC article.
-
The Equine Hoof: Laminitis, Progenitor (Stem) Cells, and Therapy Development.Toxicol Pathol. 2021 Oct;49(7):1294-1307. doi: 10.1177/0192623319880469. Epub 2019 Nov 19. Toxicol Pathol. 2021. PMID: 31741428 Review.
-
Adipose-derived mesenchymal stromal/stem cells: An update on their phenotype in vivo and in vitro.World J Stem Cells. 2014 Jul 26;6(3):256-65. doi: 10.4252/wjsc.v6.i3.256. World J Stem Cells. 2014. PMID: 25126376 Free PMC article. Review.
References
-
- Guan Y.T., Xie Y., Li D.S., Zhu Y.Y., Zhang X.L., Feng Y.L., Chen Y.P., Xu L.J., Liao P.F., Wang G. Comparison of Biological Characteristics of Mesenchymal Stem Cells Derived from the Human Umbilical Cord and Decidua Parietalis. Mol. Med. Rep. 2019;20:633–639. doi: 10.3892/mmr.2019.10286. - DOI - PMC - PubMed
MeSH terms
Substances
LinkOut - more resources
Full Text Sources
Miscellaneous
