. 2023 Jul 14;24(14):11451.
doi: 10.3390/ijms241411451.

Yersiniabactin-Producing E. coli Induces the Pyroptosis of Intestinal Epithelial Cells via the NLRP3 Pathway and Promotes Gut Inflammation

Affiliations

Yersiniabactin-Producing E. coli Induces the Pyroptosis of Intestinal Epithelial Cells via the NLRP3 Pathway and Promotes Gut Inflammation

Hao Wang et al. Int J Mol Sci. .

Abstract

The high-pathogenicity island (HPI) was initially identified in Yersinia and can be horizontally transferred to Escherichia coli to produce yersiniabactin (Ybt), which enhances the pathogenicity of E. coli by competing with the host for Fe3+. Pyroptosis is gasdermin-induced necrotic cell death. It involves the permeabilization of the cell membrane and is accompanied by an inflammatory response. It is still unclear whether Ybt HPI can cause intestinal epithelial cells to undergo pyroptosis and contribute to gut inflammation during E. coli infection. In this study, we infected intestinal epithelial cells of mice with E. coli ZB-1 and the Ybt-deficient strain ZB-1Δirp2. Our findings demonstrate that Ybt-producing E. coli is more toxic and exacerbates gut inflammation during systemic infection. Mechanistically, our results suggest the involvement of the NLRP3/caspase-1/GSDMD pathway in E. coli infection. Ybt promotes the assembly and activation of the NLRP3 inflammasome, leading to GSDMD cleavage into GSDMD-N and promoting the pyroptosis of intestinal epithelial cells, ultimately aggravating gut inflammation. Notably, NLRP3 knockdown alleviated these phenomena, and the binding of free Ybt to NLRP3 may be the trigger. Overall, our results show that Ybt HPI enhances the pathogenicity of E. coli and induces pyroptosis via the NLRP3 pathway, which is a new mechanism through which E. coli promotes gut inflammation. Furthermore, we screened drugs targeting NLRP3 from an existing drug library, providing a list of potential drug candidates for the treatment of gut injury caused by E. coli.

Keywords: E. coli; NLRP3; Ybt HPI; gut inflammation; pyroptosis.


Conflict of interest statement

The authors declare no conflict of interest.

Figures
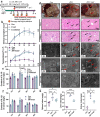
Figure 1
Figure 1
Ybt promotes systemic infection caused by E.coli: (a) a schematic diagram of the mouse infection model; (b) clinical scores of mice after infection; (c) changes in body temperature at different time points after infection; (d) anatomical changes in infected mice, including pathological changes in the liver and kidney (typical injuries indicated by black arrows, scale bar, 50 μm), and transmission electron microscope observations of E. coli-induced cell damage (typical injuries indicated by red arrows; N: nucleus, LD: lipid droplet, Mi: mitochondria, SER: smooth endoplasmic reticulum; the white square box indicates the zoomed-in location); (e,f) changes in inflammatory factors, including IL-18 and IL-1β, in the serum of infected mice (n = 3); (g) visceral index of infected mice (including the spleen, kidney, and liver). All data are presented as mean ± SD. **** p < 0.0001, *** p < 0.001, ** p < 0.01, and * p < 0.05.
Figure 2
Figure 2
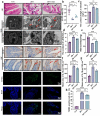
Ybt promotes intestinal inflammation induced by E.coli: (a) pathological changes in the small intestine in infected mice (scale bar, 50 μm). Transmission electron microscopy observation of E.coli damage to cells (N: nucleus, LD: lipid droplet, RER: rough endoplasmic reticulum; the local zoom location is indicated by the white square box). Representative photomicrographs of immunohistochemistry results showing the staining of IL-18 and IL-1β in different groups, and TUNEL staining (scale bar, 50 μm; typical injuries are depicted by the arrows) (n = 3); (b) the intestine’s length of villi/depth of crypts (VL/CD) was determined (n = 3); (c,d) the content of SIgA and LDH in intestine; (e) the activity of SOD in the intestine (n = 3); (f,g) the intestine’ mean density of IL-1β and IL-18 was determined (n =3); (h) semi-quantification of TUNEL-positive cells in the intestine (n = 3). All data are shown as the mean ± SD. **** p < 0.0001, *** p < 0.001, ** p < 0.01, and * p < 0.05.
Figure 3
Figure 3
The NLRP3 pathway is involved in E. coli infection: (a,b) representative photomicrographs of immunohistochemistry results showing the staining of GSDMD-N in different groups (scale bar, 50 μm; typical injuries are depicted by the arrows); the intestine’ mean density of GSDMD-N was determined (n = 3); (c,d) Western blotting was used to detect the expression levels of GSDMD and GSDMD-N in the intestine of mice and compared with β-actin (n = 3); (e) volcano plot: the volcano plot was constructed using the fold change values and p-adjusted values. Purple dots represent genes with significant fold change value and p value, blue dots represent genes with significant p value, gray dots represent genes with insignificant fold change value and p value, and green dots represent genes with significant fold change value (The red font highlights genes in the NLRP3 pathway); (f) the heatmap of the differential gene expression, with different colors representing the trend of gene expression in different tissues (The red font highlights genes in the NLRP3 pathway); (g) functional enrichment: the enriched KEGG signaling pathways were selected to demonstrate the primary biological actions of major potential mRNA (The red font highlights genes in the NOD-like receptor pathway); (h) network of interacting proteins predicted via NLRP3. All data are shown as the mean ± SD. **** p < 0.0001, and * p < 0.05.
Figure 4
Figure 4
E. coli-Ybt induces pyroptosis via the NLRP3 pathway: (a) the relative expression levels of NLRP3, ASC, caspase-1, IL-1β, and IL-18 were quantified using qRT-PCR in kidney specimens from mice (n = 3); (b) immunofluorescence staining was performed to determine the expression localization of NLRP3 and caspase-1 in the intestine. Representative photomicrographs of immunohistochemistry results showing the staining of IL-18 and IL-1β in different groups (scale bar, 50 μm; typical injuries are depicted by the arrows) (n = 3); (c) the proportion of NLRP3 and caspase-1 double-positive cells in the intestine; (d,e) the mean density of IL-1β and IL-18 in the intestine was determined (n = 3). All data are presented as mean ± SD. **** p < 0.0001, *** p < 0.001, ** p < 0.01, and * p < 0.05.
Figure 5
Figure 5
E.coli-Ybt induces pyroptosis of small intestinal epithelial cells: (a) schematic diagram of IPEC-J2 cell infection model; (bd) changes in inflammatory factors in the cell supernatant, including LDH, IL-18, and IL-1β (n = 3); (eh) the relative expression levels of NLRP3, ASC, caspase-1, and GSDMD were determined using qRT-PCR in IPEC-J2 cells (n = 3); (i) the assembly of NLRP3 and caspase-1 was observed via laser confocal microscopy (scale bar, 100 μm; the local zoom location is indicated by the white square box, typical inflammasome is represented by a white arrow) (n = 3). IPEC-J2 cells were observed via HE staining (scale bar, 50 μm; typical injuries are depicted by the black arrows); (j) Western blotting was used to detect the expression levels of NLRP3, GSDMD, and GSDMD-N in IPEC-J2 cells in different treatment groups and compared with β-actin (n = 3). All data are shown as the mean ± SD. **** p < 0.0001, *** p < 0.001, ** p < 0.01, and * p < 0.05.
Figure 6
Figure 6
Knockdown of NLRP3 alleviates E.coli-Ybt-induced pyroptosis: (a) the relative expression levels of ASC, GSDMD, caspase-1, IL-18, and IL-1β were determined using qRT-PCR in both IPEC-J2 cells and after NLRP3 knockdown (n = 3); (b) the assembly of NLRP3 and caspase-1 was observed via laser confocal microscopy in both IPEC-J2 cells and after NLRP3 knockdown (scale bar, 100 μm; the local zoom location is indicated by the white square box, typical inflammasome is represented by a white arrow) (n = 3); (c) Western blotting was used to detect the expression levels of GSDMD and GSDMD-N in IPEC-J2 cells in different treatment groups and compared with β-actin (n = 3); (d,e) changes in inflammatory factors in the cell supernatant, including IL-18 and IL-1β (n = 3); (f) IPEC-J2 cells were observed via HE staining (scale bar, 50 μm; typical injuries are depicted by the red arrows). All data are shown as the mean ± SD. **** p < 0.0001, ** p < 0.01, and * p < 0.05.
Figure 7
Figure 7
Ybt binds to NLRP3 to induce pyroptosis: (a,b) after E. coli infection, the cells of both IPEC-J2 cells and the NLRP3 knockdown group were stained with propidium iodide (PI) (scale bar, 50 μm). The positive cell rate of PI staining was then determined. (n = 3); (c) the 3D structure of siderophore Ybt and NLRP3 building pockets; (d) the optimal binding structure of Ybt and NLRP3 protein with the local magnification of the binding site. All data are shown as the mean ± SD. **** p < 0.0001.
Figure 8
Figure 8
Screening of drug libraries targeting NLRP3: (a) molecular docking of digitoxin and NLRP3; (b) molecular docking of eltrombopag and NLRP3; (c) molecular docking of isavuconazonium and NLRP3; (d) molecular docking of dexamethasone metasulfobenzoate and NLRP3; (e) molecular docking of paliperidone and NLRP3.
Figure 9
Figure 9
This figure demonstrates that Ybt exacerbates the susceptibility to E. coli-induced intestinal inflammation. In addition, intestinal epithelial cell pyroptosis represents another mechanism of intestinal inflammation triggered by E. coli infection in mice, and Ybt can induce intestinal injury by promoting pyroptosis.

Similar articles

Cited by

References

    1. Carniel E., Guilvout I., Prentice M. Characterization of a large chromosomal “high-pathogenicity island” in biotype 1B Yersinia enterocolitica. J. Bacteriol. 1996;178:6743–6751. doi: 10.1128/jb.178.23.6743-6751.1996. - DOI - PMC - PubMed
    1. Hacker J., Blum-Oehler G., Mühldorfer I., Tschäpe H. Pathogenicity islands of virulent bacteria: Structure, function and impact on microbial evolution. Mol. Microbiol. 1997;23:1089–1097. doi: 10.1046/j.1365-2958.1997.3101672.x. - DOI - PubMed
    1. Ellermann M., Gharaibeh R., Fulbright L., Dogan B., Moore L., Broberg C., Lopez L., Rothemich A., Herzog J., Rogala A., et al. Yersiniabactin-Producing Adherent/Invasive Escherichia coli Promotes Inflammation-Associated Fibrosis in Gnotobiotic Il10-/- Mice. Infect. Immun. 2019;87:e00587-19. doi: 10.1128/IAI.00587-19. - DOI - PMC - PubMed
    1. Paauw A., Leverstein-van Hall M., van Kessel K., Verhoef J., Fluit A. Yersiniabactin reduces the respiratory oxidative stress response of innate immune cells. PLoS ONE. 2009;4:e8240. doi: 10.1371/journal.pone.0008240. - DOI - PMC - PubMed
    1. Dobrindt U., Blum-Oehler G., Nagy G., Schneider G., Johann A., Gottschalk G., Hacker J. Genetic structure and distribution of four pathogenicity islands (PAI I536 to PAI IV536) of uropathogenic Escherichia coli strain 536. Infect. Immun. 2002;70:6365–6372. doi: 10.1128/IAI.70.11.6365-6372.2002. - DOI - PMC - PubMed

MeSH terms