. 2023 Jul 15;24(14):11506.
doi: 10.3390/ijms241411506.

Cell-Based Measurement of Mitochondrial Function in Human Airway Smooth Muscle Cells

Affiliations

Cell-Based Measurement of Mitochondrial Function in Human Airway Smooth Muscle Cells

Sanjana Mahadev Bhat et al. Int J Mol Sci. .

Abstract

Cellular mitochondrial function can be assessed using high-resolution respirometry that measures the O2 consumption rate (OCR) across a number of cells. However, a direct measurement of cellular mitochondrial function provides valuable information and physiological insight. In the present study, we used a quantitative histochemical technique to measure the activity of succinate dehydrogenase (SDH), a key enzyme located in the inner mitochondrial membrane, which participates in both the tricarboxylic acid (TCA) cycle and electron transport chain (ETC) as Complex II. In this study, we determine the maximum velocity of the SDH reaction (SDHmax) in individual human airway smooth muscle (hASM) cells. To measure SDHmax, hASM cells were exposed to a solution containing 80 mM succinate and 1.5 mM nitroblue tetrazolium (NBT, reaction indicator). As the reaction proceeded, the change in optical density (OD) due to the reduction of NBT to its diformazan (peak absorbance wavelength of 570 nm) was measured using a confocal microscope with the pathlength for light absorbance tightly controlled. SDHmax was determined during the linear period of the SDH reaction and expressed as mmol fumarate/liter of cell/min. We determine that this technique is rigorous and reproducible, and reliable for the measurement of mitochondrial function in individual cells.

Keywords: airway smooth muscle; confocal microscope; mitochondria; oxygen consumption; succinate dehydrogenase.


Conflict of interest statement

The authors declare that the research was conducted in the absence of any commercial or financial relationships that could be construed as a potential conflict of interest.

Figures

Figure 1
Figure 1
An overview of the quantitative histochemical technique for measurement of the maximum velocity of the succinate dehydrogenase reaction (SDHmax). In the SDH reaction, the progressive reduction of nitroblue tetrazolium (NBT) to its diformazan (NBTdfz) is used as the reaction indicator. The reaction is performed in the presence of 1-methoxyphenazine methosulphate (mPMS), an exogenous electron carrier, and azide to inhibit cytochrome oxidase (Complex IV). The accumulation of NBTdfz within a 3D region of interest in an hASM cell was measured every 15 s across a 10-min period as the change in OD at 570 nm. (Created with BioRender.com).
Figure 2
Figure 2
(A) Representative image shows the change in OD within a delineated intact hASM cell at 0, 4, and 8 min during the SDH reaction (Scale bar  =  10 μm). Individual hASM cells were delineated as the region of interest (ROI) for the measurement of change in OD while the nucleus was excluded from the ROI (N: Nucleus, C: Cytoplasm, +: Nuclear centroid computed using NIS-Elements software). (B) In intact and permeabilized hASM cells, the OD was measured every 15 s over a 10 min period, with and without substrate (succinate). In both intact and permeabilized hASM cells, the SDH reaction was found to be linear (R2 = 0.99) across an 8 min period in the presence of 80 mM and 10 mM substrate, respectively. The rate in the presence of substrate was significantly higher compared to the SDH reaction without substrate (p < 0.0001). Results were analyzed using a simple linear regression model. Circles represent SDH reaction performed in intact cells with 80 mM succinate, squares represent SDH reaction performed in permeabilized cells with 10 mM succinate, and triangles represent SDH reaction performed without succinate. (C) The SDHmax produced with 10 mM succinate in permeabilized cells was comparable to the SDHmax produced with 80 mM succinate in intact cells. Data are presented as mean ± SD in a scatter plot. The results represent SDHmax from one bronchial sample (patient). Circles represent SDH reaction performed in intact cells with 80 mM succinate and squares represent SDH reaction performed in permeabilized cells with 10 mM succinate. Statistical analyses in hASM cells were based on measurements from n = 20 hASM cells using a paired t-test.
Figure 3
Figure 3
The reaction product (NBTdfz) is distributed within hASM cells. (A) Representative diagram showing a delineated ROI within an hASM cell centered at mid-nucleus (scale bar  =  50 μm). The nucleus was excluded from the ROI. (B,C) A Z-stack with a controlled optical slice thickness of 0.5 µm was centered at mid-nucleus and extended for 5 µm in the z-axis with a step size of 0.5 µm (10 optical slices) or 1.0 µm (5 optical slices), (N: nucleus, C: cytoplasm). (D) In intact hASM cells, the OD was measured every 15 s over a 10 min period. The SDH reaction was found to be linear across an 8 min period at 0.5 µm step size (R2 = 0.99) and 1.0 µm step size (R2 = 0.98). Results were analyzed using a simple linear regression model. Circles represent SDH reaction performed at 0.5 µm step size and squares represent SDH reaction performed at 1.0 µm step size. (E) The mean SDHmax from all optical slices obtained at a step size of 0.5 and 1.0 µm between optical slices was measured and the SDHmax within the total volume of the hASM cells across all patients was compared. No significant difference in SDHmax was observed between the two sampling parameters. Data are presented as mean ± SD in a scatter plot. Data represent results from one bronchial sample (patient), circles represent optical slices obtained at 0.5 µm step size, and squares represent optical slices obtained at 1.0 µm step size. Statistical analyses in hASM cells were based on measurements from n = 20 hASM cells per patient using a paired t-test.
Figure 4
Figure 4
The NBTdfz OD is proportional to pathlength. (A) Representative diagram showing a delineated ROI within an hASM cell centered at mid-nucleus in the XY plane (scale bar  =  50 μm). The nucleus was excluded from the ROI. (B,C) Z-stack with a controlled step size of 0.5 µm between optical slices was obtained with an optical slice thickness of 0.5 µm (10 optical slices) or 1.0 µm (5 optical slices), (N: nucleus, C: cytoplasm). (D) In intact hASM cells, the OD was measured every 15 s over a 10 min period. The SDH reaction was found to be linear (R2 = 0.99) across an 8 min period with both optical slice thicknesses, 0.5 µm and 1.0 µm. Results were analyzed using a simple linear regression model. Data represent results from one bronchial sample (patient), circles represent SDH reaction performed at an optical slice thickness of 0.5 µm, and squares represent SDH reaction performed at an optical slice thickness of 1.0 µm. (E) The mean SDHmax measured from all optical slices obtained with an optical slice thickness of 0.5 µm was comparable to the mean SDHmax measured with an optical slice thickness of 1.0 µm. Data are presented as mean ± SD in a scatter plot. Each dot represents results from an individual hASM cell, circles represent SDH reaction performed at an optical slice thickness of 0.5 µm, and squares represent SDH reaction performed at an optical slice thickness of 1.0 µm. Statistical analyses in hASM cells were based on measurements from n = 20 hASM cells from a single patient using a paired t-test.
Figure 5
Figure 5
SDHmax is reproducible across different patients. The range of SDHmax within hASM cells was measured across different patient samples. SDHmax measurements averaged 25.86 × 10⁻⁷ ± 1.88 mmol fumarate L cell−1 min−1 across patients while showing low variability within each patient when compared to that across patients. Data are presented as mean ± SD in a scatter plot. Each color represents results from one bronchial sample (patients). Circles represent hASM cells dissociated from male patients and squares represent hASM cells dissociated from female patients. For each patient, SDHmax was measured in n = 30 hASM cells per patient from 6 bronchial samples (patients).
Figure 6
Figure 6
MitoTracker labeling decreases SDHmax measurement. (A) Representative maximum intensity Z-projection image of hASM cells loaded with MitoTracker® Green FM to visualize mitochondria. Multiple hASM cells were visualized within a single microscopic field and were used for mitochondrial volume density measurements (scale bar  =  50 μm). (B) In delineated hASM cells, SDHmax was measured after labeling with MitoTracker® Green FM. SDHmax in hASM cells loaded with MitoTracker was decreased compared to unlabeled hASM cells (* p < 0.0001). Each dot represents results from an individual hASM cell, circles represent SDHmax measurements from unlabeled (control) cells, and squares represent SDHmax measurements from MitoTracker labeled cells. Data are presented as mean ± SD in a scatter plot. Statistical analyses in hASM cells were based on measurements from n = 20 hASM cells per group from a single patient using paired-t test. (C) Mitochondrial volume density was measured using Z-stack fluorescent images of hASM cells and 3D reconstruction using ImageJ. The mitochondrial volume densities varied within patients with an average density of ∼14% across patients. Data are presented as mean ± SD in a scatter plot. Each color represents results from one bronchial sample (patient). Circles represent hASM cells dissociated from male patients and squares represent hASM cells dissociated from female patients. For each patient, mitochondrial volume density was measured in n = 30 hASM cells per patient from 6 bronchial samples (patients). (D) SDHmax showed a positive linear relationship with mitochondrial volume density but was not significant. Scatterplot shows the relationship between SDHmax (y-axis) and mean mitochondrial volume density (x-axis) across all hASM patients (slope = 0.8, R2 = 0.62, p > 0.05) determined by Pearson’s correlation. Circles represent hASM cells dissociated from male patients, and squares represent hASM cells dissociated from female patients.
Figure 7
Figure 7
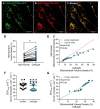
SDHmax is dependent on mitochondrial volume density. (A,B) Representative maximum intensity Z-projection image of hASM cells transduced with CellLight Mitochondria-GFP and labeled with MitoTracker® Red FM to visualize mitochondria (scale bar  =  50 μm). (C) Overlay of the images of the two fluorescence labels confirmed that the pattern of CellLight labeling was restricted to mitochondria, similar to MitoTracker. (D) The mitochondrial volume density was measured using the 3D reconstruction of Z-stack fluorescent images of hASM cells, loaded with CellLight and MitoTracker, using ImageJ. Mitochondrial volume density measured in CellLight labeled hASM cells was significantly higher compared to that measured in MitoTracker labeled hASM cells (* p < 0.001). Each dot represents mitochondrial volume density of an individual hASM cell from a single patient with lines showing the change in mitochondrial volume density measured in the same hASM cell labeled with CellLight. Circles represent measurements from MitoTracker labeled hASM cells and squares represent measurements from CellLight transduced hASM cells. (E) Scatterplot shows the positive linear relationship between the mitochondrial volume density measured with CellLight (y-axis) and MitoTracker (x-axis) across cells (slope = 0.98, R2 = 0.95, p < 0.0001) determined by Pearson’s correlation. Statistical analyses in hASM cells were based on measurements from n = 20 hASM cells per group from a single patient. (F) SDHmax was measured in individual hASM cells after CellLight labeling. SDHmax in CellLight labeled hASM cells was unchanged compared to untransduced (control) cells. Each dot represents results from an individual hASM cell, circles represent SDHmax measurements from untransduced (control) cells, and squares represent SDHmax measurements from CellLight transduced cells. Data are presented as mean ± SD. Statistical analyses in hASM cells were based on measurements from n = 20 hASM cells per group from a single patient using a paired-t test. (G) SDHmax showed a significant positive linear relationship with mitochondrial volume density measured by CellLight labeling. Scatterplot shows the relationship between SDHmax (y-axis) and mitochondrial volume density (x-axis) across cells (slope = 0.93, R2 = 0.87, p < 0.0001) determined by Pearson’s correlation.
Figure 8
Figure 8
O2 consumption rate (OCR) normalized to mitochondrial volume density correlates with SDHmax in hASM cells. (A) The raw XF traces of the mitochondrial stress test were performed with the sequential use of 1 µM oligomycin (ATP uncoupler), 1.25 µM FCCP (proton ionophore), and 1 µM antimycin A (Complex III inhibitor) with 1 µM rotenone (Complex I inhibitor). Data are presented as mean ± SEM. Each color represents results from one bronchial sample (patient). Circles represent hASM cells dissociated from male patients and squares represent hASM cells dissociated from female patients. For each patient, OCR was measured in n = 4 wells per patient, from 6 bronchial samples (patients). (B) The maximum OCR in hASM cells was normalized to the total cell count obtained before and after assaying. Maximum OCR values across patients ranged between 0.0061 ± 0.0006 and 0.012 ± 0.001 pmol min−1 cell−1 when normalized to cell count before and after assay, respectively. Data are presented as box-whisker plots showing the median and minimum to maximum distribution of maximum OCR from all six patients. Each color represents results from one bronchial sample (patient), circles represent maximum OCR normalized to cell count obtained before stress test, and squares represent maximum OCR normalized to cell count obtained after stress test. (C) SDHmax was not correlated with maximum OCR per cell. Scatterplot shows the relationship between SDHmax (y-axis) and mean OCR per cell (x-axis) across all hASM patients (slope = 0.32, R2 = 0.10, p > 0.05) determined by Pearson’s correlation. Circles represent hASM cells dissociated from male patients and squares represent hASM cells dissociated from female patients. (D) Maximum OCR in hASM cells was normalized for mitochondrial volume density (MVD). Data are presented as mean ± SEM in a scatter plot. Each color represents results from one bronchial sample (patient). Circles represent hASM cells dissociated from male patients and squares represent hASM cells dissociated from female patients. (E) Scatterplot shows the positive linear relationships between SDHmax (y-axis) and mean OCR per mitochondrion (x-axis) across all hASM patients (slope = 0.98, R2 = 0.96, p < 0.01) determined by Pearson’s correlation. Circles represent hASM cells dissociated from male patients and squares represent hASM cells dissociated from female patients.
Figure 9
Figure 9
Confirmation of hASM phenotype. (A) Representative maximum intensity Z-projection image of dissociated cells. The phenotype of dissociated human airway smooth muscle (hASM) cells was assessed based on immunoreactivity to α-smooth muscle actin (α-SMA) expression. α-SMA immunoreactive hASM cells were larger (scale bar  =  50 μm). (B) Column bar graph represents the percentage of hASM cells determined as the fraction of α-SMA expressing cells relative to the total dissociated cells (determined from DAPI) from 6 patient samples (n = 120 hASM cells per patient). Note that ~95% of total dissociated cells were immunoreactive to α-SMA.
Figure 10
Figure 10
Calibration of gray level (GL) to known optical density (OD). The measured gray level (GL) of the microscope was calibrated to known optical density (OD) units using a photographic density stepwedge tablet. The dynamic range during image acquisition was adjusted to take advantage of the 4096 gray levels in the 12-bit system. The GL of the acquisition system was measured and plotted to the known OD units provided in the stepwedge tablet (0.04–2.20 OD units in increments of 0.15 OD). The data obtained were analyzed by a four-parameter general curve fit function to derive an equation (Equation (1)), which was used to transform measured GL values to OD in unknown samples.

Similar articles

Cited by

References

    1. Moosavi B., Berry E.A., Zhu X.L., Yang W.C., Yang G.F. The assembly of succinate dehydrogenase: A key enzyme in bioenergetics. Cell. Mol. Life Sci. 2019;76:4023–4042. doi: 10.1007/s00018-019-03200-7. - DOI - PMC - PubMed
    1. Sieck G.C., Sacks R.D., Blanco C.E., Edgerton V.R. SDH activity and cross-sectional area of muscle fibers in cat diaphragm. J. Appl. Physiol. 1986;60:1284–1292. doi: 10.1152/jappl.1986.60.4.1284. - DOI - PubMed
    1. Blanco C.E., Sieck G.C., Edgerton V.R. Quantitative histochemical determination of succinic dehydrogenase activity in skeletal muscle fibres. Histochem. J. 1988;20:230–243. doi: 10.1007/BF01747468. - DOI - PubMed
    1. Blanco C.E., Micevych P.E., Zhan W.Z., Sieck G.C. Succinate dehydrogenase activity of sexually dimorphic muscles of rats. J Appl. Physiol. 1995;78:2147–2152. doi: 10.1152/jappl.1995.78.6.2147. - DOI - PubMed
    1. Sieck G.C., Fournier M., Prakash Y.S., Blanco C.E. Myosin phenotype and SDH enzyme variability among motor unit fibers. J. Appl. Physiol. 1996;80:2179–2189. doi: 10.1152/jappl.1996.80.6.2179. - DOI - PubMed