

Intratumor Heterogeneity and Treatment Resistance of Solid Tumors with a Focus on Polyploid/Senescent Giant Cancer Cells (PGCCs)
- PMID: 37511291
- PMCID: PMC10380821
- DOI: 10.3390/ijms241411534
Intratumor Heterogeneity and Treatment Resistance of Solid Tumors with a Focus on Polyploid/Senescent Giant Cancer Cells (PGCCs)
Abstract
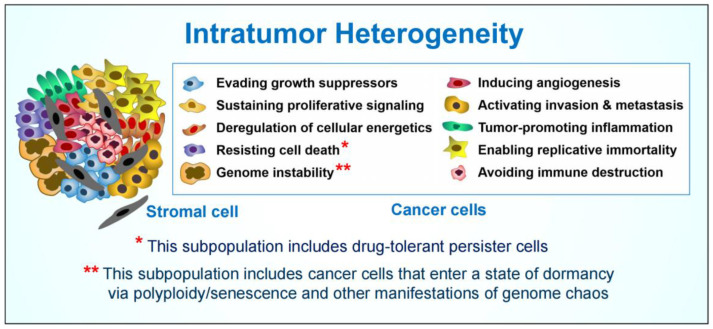
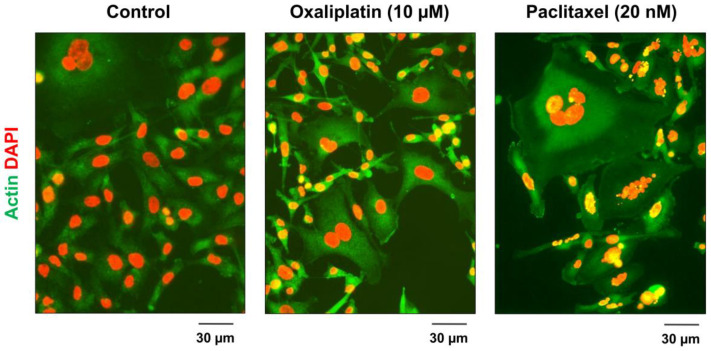
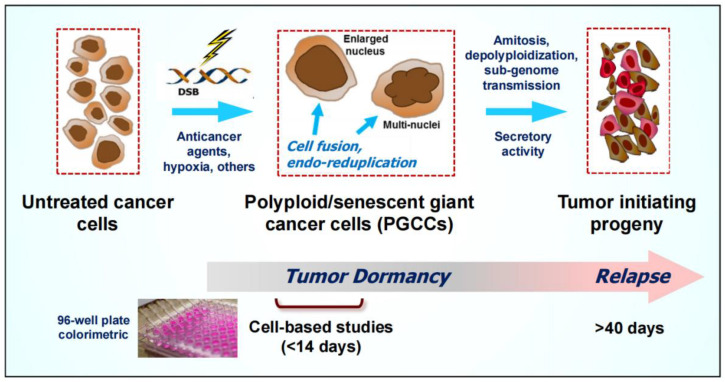
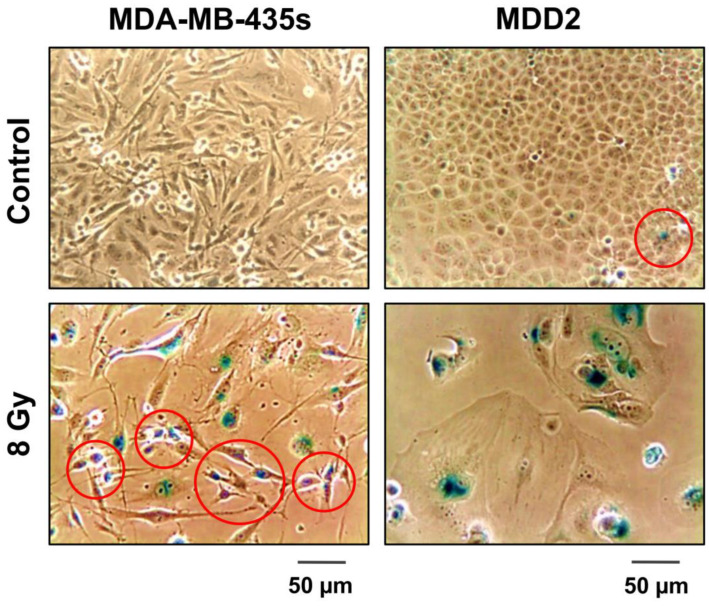
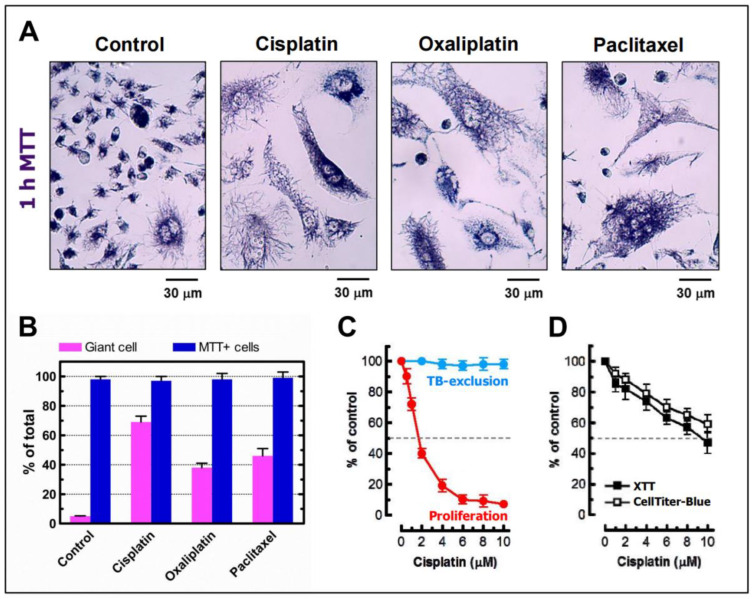
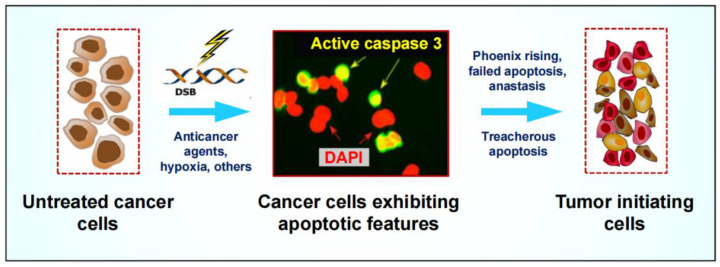
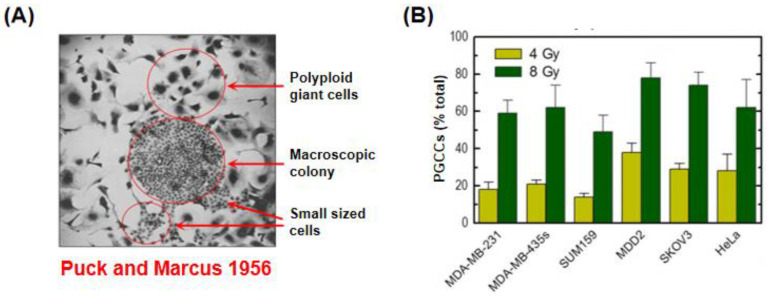
Single cell biology has revealed that solid tumors and tumor-derived cell lines typically contain subpopulations of cancer cells that are readily distinguishable from the bulk of cancer cells by virtue of their enormous size. Such cells with a highly enlarged nucleus, multiple nuclei, and/or multiple micronuclei are often referred to as polyploid giant cancer cells (PGCCs), and may exhibit features of senescence. PGCCs may enter a dormant phase (active sleep) after they are formed, but a subset remain viable, secrete growth promoting factors, and can give rise to therapy resistant and tumor repopulating progeny. Here we will briefly discuss the prevalence and prognostic value of PGCCs across different cancer types, the current understanding of the mechanisms of their formation and fate, and possible reasons why these tumor repopulating "monsters" continue to be ignored in most cancer therapy-related preclinical studies. In addition to PGCCs, other subpopulations of cancer cells within a solid tumor (such as oncogenic caspase 3-activated cancer cells and drug-tolerant persister cancer cells) can also contribute to therapy resistance and pose major challenges to the delivery of cancer therapy.
Keywords: anastasis; apoptosis; cancer therapy; intratumor heterogeneity; polyploid giant cancer cells; precision oncology; preclinical assays; senescence.
Conflict of interest statement
The authors declare no conflict of interest.
Figures
Similar articles
-
Single-Cell MTT: A Simple and Sensitive Assay for Determining the Viability and Metabolic Activity of Polyploid Giant Cancer Cells (PGCCs).Methods Mol Biol. 2024;2825:293-308. doi: 10.1007/978-1-0716-3946-7_17. Methods Mol Biol. 2024. PMID: 38913317
-
Dormant cancer cells and polyploid giant cancer cells: The roots of cancer recurrence and metastasis.Clin Transl Med. 2024 Feb;14(2):e1567. doi: 10.1002/ctm2.1567. Clin Transl Med. 2024. PMID: 38362620 Free PMC article. Review.
-
Polyploid Giant Cancer Cells (PGCCs): The Evil Roots of Cancer.Curr Cancer Drug Targets. 2019;19(5):360-367. doi: 10.2174/1568009618666180703154233. Curr Cancer Drug Targets. 2019. PMID: 29968537
-
Dedifferentiation into blastomere-like cancer stem cells via formation of polyploid giant cancer cells.Oncogene. 2017 Aug 24;36(34):4887-4900. doi: 10.1038/onc.2017.72. Epub 2017 Apr 24. Oncogene. 2017. PMID: 28436947 Free PMC article.
-
Polyploid giant cancer cells: origin, possible pathways of formation, characteristics, and mechanisms of regulation.Front Cell Dev Biol. 2024 Jul 11;12:1410637. doi: 10.3389/fcell.2024.1410637. eCollection 2024. Front Cell Dev Biol. 2024. PMID: 39055650 Free PMC article. Review.
Cited by
-
Harnessing the interaction between redox signaling and senescence to restrain tumor drug resistance.Front Cell Dev Biol. 2025 Jul 9;13:1639772. doi: 10.3389/fcell.2025.1639772. eCollection 2025. Front Cell Dev Biol. 2025. PMID: 40703657 Free PMC article. Review.
-
An unscheduled switch to endocycles induces a reversible senescent arrest that impairs growth of the Drosophila wing disc.bioRxiv [Preprint]. 2024 Mar 14:2024.03.14.585098. doi: 10.1101/2024.03.14.585098. bioRxiv. 2024. Update in: PLoS Genet. 2024 Sep 3;20(9):e1011387. doi: 10.1371/journal.pgen.1011387. PMID: 38559130 Free PMC article. Updated. Preprint.
-
Polyploidy Promotes Hypertranscription, Apoptosis Resistance, and Ciliogenesis in Cancer Cells and Mesenchymal Stem Cells of Various Origins: Comparative Transcriptome In Silico Study.Int J Mol Sci. 2024 Apr 10;25(8):4185. doi: 10.3390/ijms25084185. Int J Mol Sci. 2024. PMID: 38673782 Free PMC article.
-
Prognostic Factors and Markers in Non-Small Cell Lung Cancer: Recent Progress and Future Challenges.Genes (Basel). 2023 Oct 4;14(10):1906. doi: 10.3390/genes14101906. Genes (Basel). 2023. PMID: 37895255 Free PMC article. Review.
-
Changing the Landscape of Solid Tumor Therapy from Apoptosis-Promoting to Apoptosis-Inhibiting Strategies.Curr Issues Mol Biol. 2024 May 28;46(6):5379-5396. doi: 10.3390/cimb46060322. Curr Issues Mol Biol. 2024. PMID: 38920994 Free PMC article. Review.
References
-
- Morgan S.E., Kastan M.B. p53 and ATM: Cell cycle, cell death, and cancer. Adv. Cancer Res. 1997;71:1–25. - PubMed
Publication types
MeSH terms
LinkOut - more resources
Full Text Sources
Medical
Research Materials
