. 2023 Jul 18;24(14):11610.
doi: 10.3390/ijms241411610.

Inhibitor Trapping in N-Myristoyltransferases as a Mechanism for Drug Potency

Affiliations

Inhibitor Trapping in N-Myristoyltransferases as a Mechanism for Drug Potency

Danislav S Spassov et al. Int J Mol Sci. .

Abstract

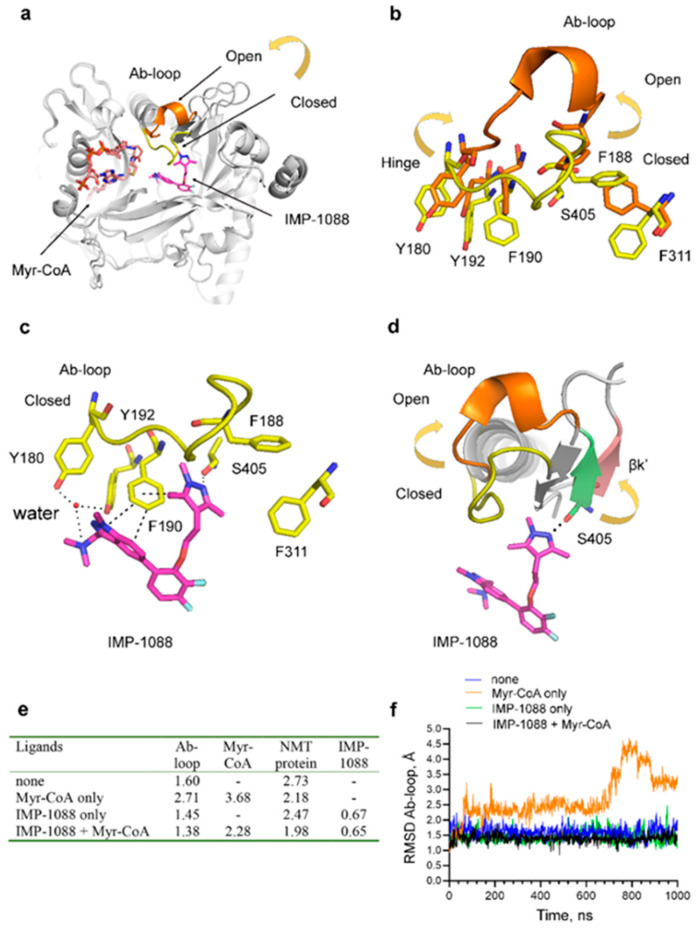
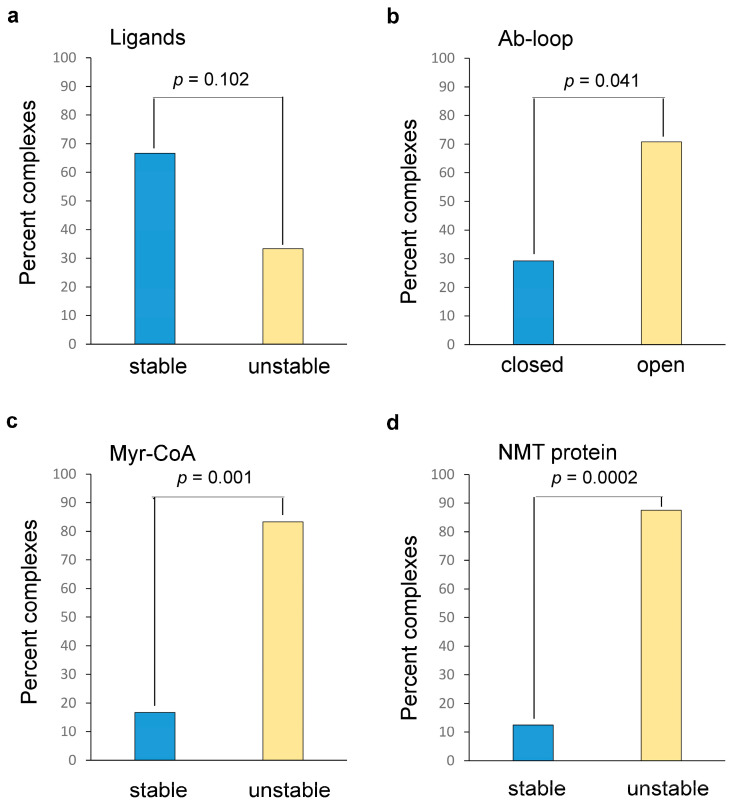
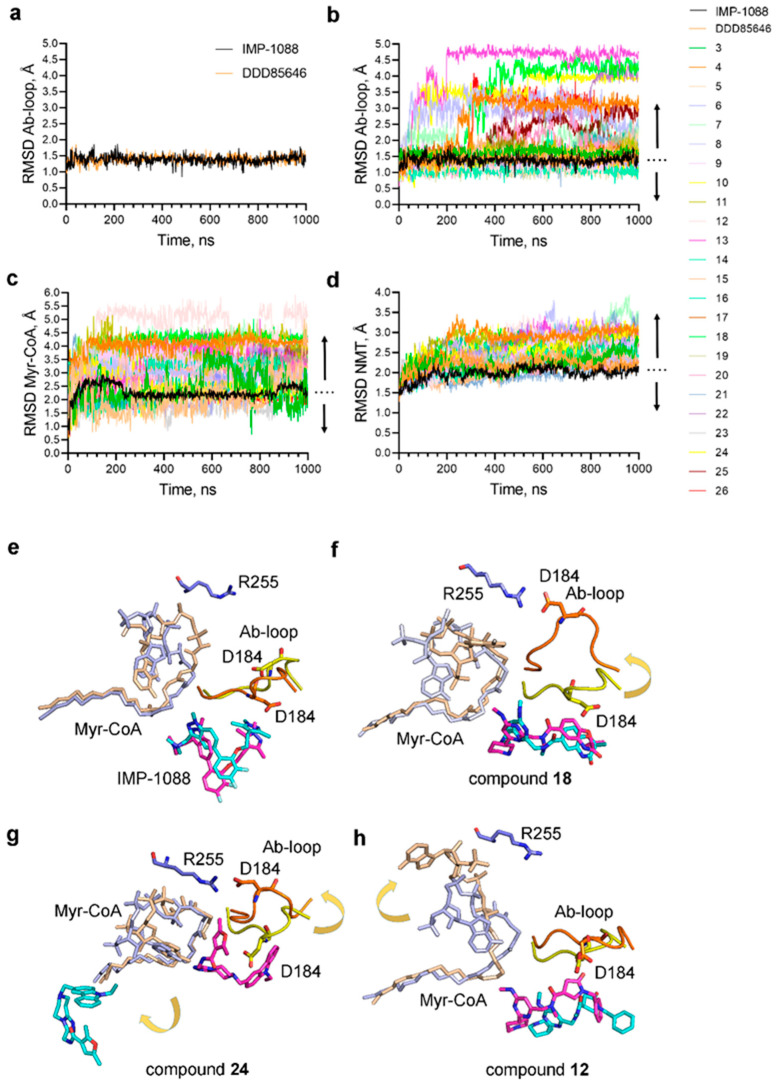
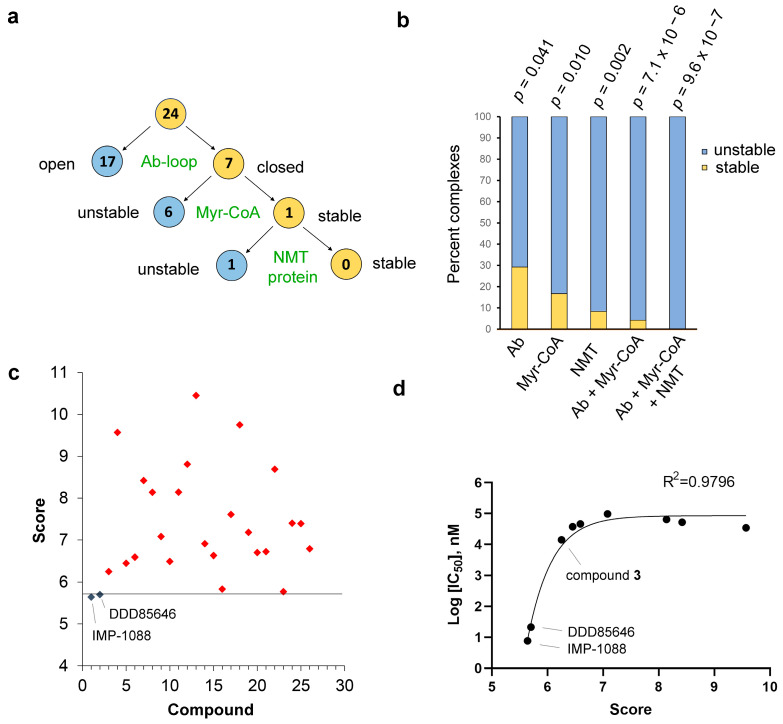
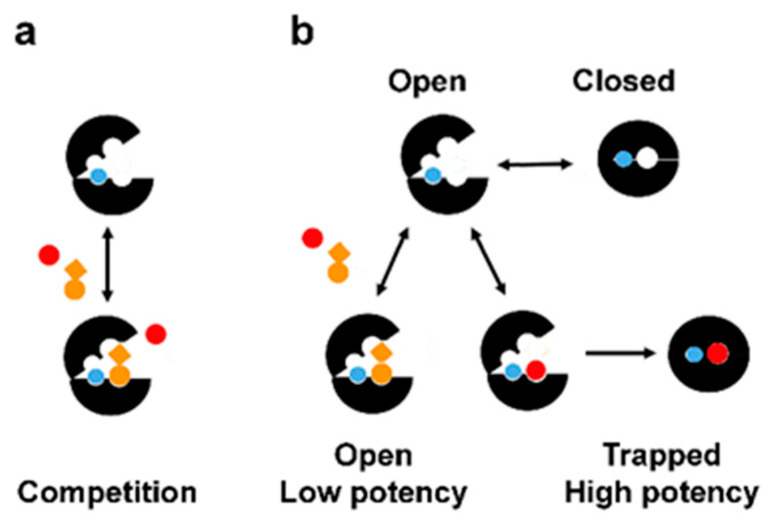
Predicting inhibitor potency is critical in drug design and development, yet it has remained one of computational biology's biggest unresolved challenges. Here, we show that in the case of the N-myristoyltransferase (NMT), this problem could be traced to the mechanisms by which the NMT enzyme is inhibited. NMT adopts open or closed conformations necessary for orchestrating the different steps of the catalytic process. The results indicate that the potency of the NMT inhibitors is determined by their ability to stabilize the enzyme conformation in the closed state, and that in this state, the small molecules themselves are trapped and locked inside the structure of the enzyme, creating a significant barrier for their dissociation. By using molecular dynamics simulations, we demonstrate that the conformational stabilization of the protein molecule in its closed form is highly correlated with the ligands activity and can be used to predict their potency. Hence, predicting inhibitor potency in silico might depend on modeling the conformational changes of the protein molecule upon binding of the ligand rather than estimating the changes in free binding energy that arise from their interaction.

Keywords: N-myristoyltransferases; NMT; conformational stability and dynamics; drug design; drug potency; enzyme inhibition; inhibitor potency; inhibitor trap; mechanism of inhibition; predicting inhibitor activity.


Conflict of interest statement

The authors declare no conflict of interest. The funders had no role in the design of the study, in the collection, analysis, or interpretation of data, in the writing of the manuscript, or in the decision to publish the results.

Figures

Figure 1
Figure 1
The 3D structure of NMT. The images depict the ternary HsNMT1: Myr-CoA: Substrate peptide complex (PDB 6QRM, monomer B). (a) A view of the whole molecule; (b) A zoomed view of the catalytic centre. NMT contains two adjacent binding pockets for binding the cofactor Myr-CoA, shown in cyan, and for the substrate peptide, shown in magenta. In this binding mode, the N-terminus of the substrate peptide is near the thioester bond of Myr-CoA, facilitating the transfer of myristic acid from Myr-CoA to the peptide during the myristoylation reaction. Access to the peptide binding pocket is controlled by the Ab-loop shown in yellow. The hinge region, described for the first time in this study, is shown in orange and regulates the opening and closing of the Ab-loop. The C-terminus of NMT, shown in green, is located in the enzyme’s active site, and its free carboxyl group serves as a catalytic base during the reaction.
Figure 2
Figure 2
Structures and binding modes of the NMT inhibitors IMP-1088 and DDD85646. (a) The 2D structures of IMP-1088 and DDD85646 are shown. The compounds are positively charged at neutral pH, as indicated: (b) IMP-1088 (PDB 5MU6) and DDD85646 (PDB 3IWE) interact within the peptide binding pocket of NMT; (c) IMP-1088 and DDD85646 form a salt bridge through their positively charged chemical groups with the negatively charged C-terminus of NMT and a hydrogen bond with Ser405 through their pyrazole rings.
Figure 3
Figure 3
Fragment synergy could be due to the stabilization of the Ab-loop in its closed state; (a) Structures of IMP-72 and IMP-358, intermediate fragments in the development of IMP-1088; (b) IC50 of IMP-72 or IMP-358 as single agents or IMP-72 in the presence of 100 µM IMP-358. The fragments display remarkable synergism; (c) Structural superimposition of binary PvNMT: Myr-CoA (PDB 4B10, yellow), ternary PvNMT: Myr-CoA: IMP-72 (PDB 5O48, cyan), and quaternary PvNMT: Myr-CoA: IMP-72: IMP-358 (PDB 5O4V, green) complexes. The carbon atoms of IMP-358 are shown in light grey, and those of IMP-72 in a darker shade of grey; (d) A zoomed view of the boxed region in the image on the left. Arrows indicate conformational movements of the depicted residues due to the binding of the fragments. The figure shows that all major conformational changes are proximal and that the binding of IMP-72 does not induce distal conformational changes in the binding pocket of IMP-358 and vice versa. The numbering corresponds to the position of the amino acid residues in HsNMT1. Y296 corresponds to Y211, F188 to F103, F190 to F105, F311 to F226, and S405 to S319 in PvNMT; (e) Average RMSD in angstroms (Å) of the heavy atoms of the Ab-loop, the whole NMT protein, IMP-72, and IMP-358 based on MD simulations of the crystal structure PDB 5O4V, either in the absence of fragments or in the presence of IMP-72, IMP-358, or both of them; (f) RMSD values of the heavy atoms of the Ab-loop in the time course of MD simulations. RMSD < 1.5 Å indicates that the Ab-loop remains locked in its closed conformation by IMP-358.
Figure 4
Figure 4
NMT inhibitors are bound inside the closed NMT conformation. The whole NMT protein structures are displayed on the panels on the left, and zoomed views of the boxed areas are shown on the right. (a,b) Superimposition of the crystal structures of HsNMT1 in complex with a substrate peptide (PDB 6QRM, yellow) or the NMT inhibitors DDD85646 (PDB 3IWE, cyan) and IMP-1088 (PDB 5MU6, green; IMP-1008 and Ab-loop highlighted in magenta) is shown. In all structures, the Ab-loop is in a closed conformation; (c,d) the surface representation of the ternary complex of HsNMT1: IMP-1088: Myr-CoA, based on crystal structure PDB 5MU6, is depicted. IMP-1088 (green) is partially visible and bound inside the closed conformation of NMT; (e,f) Superimposition of the crystal structures of HsNMT1: Myr-CoA binary complex (PDB 3IU1, yellow) and HsNMT1: Myr-CoA: IMP-1088 ternary complex (PDB 5MU6, green; IMP-1008, Myr-CoA, and Ab-loop are highlighted in magenta).
Figure 5
Figure 5
NMT inhibitors tether the Ab-loop in the closed conformation. (ad) Structural superimposition of binary ScNMT: Myr-CoA complex (PDB 1IIC) with Ab-loop in the open configuration (orange) and ternary HsNMT1: Myr-CoA: IMP-1088 complex (PDB 5MU6) with Ab-loop in the closed conformation (yellow); (a) Whole NMT molecule; (b) A zoomed view of the open and closed Ab-loop conformations. The opening of the Ab-loop is accompanied by significant changes in the positions of the depicted aromatic phenylalanine and tyrosine residues at the base of the loop. Residues from the open NMT conformation are shown in orange and from the closed in yellow; (c) Interactions between IMP-1088 and residues at the hinge region of the closed Ab-loop include stacking interactions with F190 and a water bridge with Y192. The inhibitor also forms a hydrogen bond with Ser405 and a water bridge with Y180 from the Ab-loop. In the open conformation of the Ab-loop, these residues are pushed up and not available for interaction with the inhibitor; (d) The opening of the Ab-loop is accompanied by rotation of the βk′ sheet, where S405 is located. The position of the βk′ sheet in the structure with an open Ab-loop is shown in strawberry and in the structure with a closed Ab-loop in green. The formation of a hydrogen bond between the inhibitor and S405 is expected to hinder this movement and stabilize the closed Ab-loop conformation; (e) Average RMSD in angstroms (Å) of the heavy atoms of the Ab-loop, Myr-CoA, the entire NMT protein, and IMP-1088, based on MD simulations of the Apo NMT enzyme (none) or its binary or ternary complexes with Myr-CoA and IMP-1088; (f) RMSD values of the heavy atoms of the Ab-loop in the time course of MD simulations. RMSD < 1.5 Å indicates that the Ab-loop remains locked in its closed conformation, and RMSD > 1.5 Å indicates that it opens.
Figure 6
Figure 6
The Ab-loop, My-CoA, and NMT protein dynamics are significantly related to the ligands’ activity. The graphs depict the distribution of RMSD of the indicated parameters in the NMT complexes with the 24 ligands identified by virtual screening, relative to the complexes of the control NMT inhibitors; (a) Percent of stable or unstable NMT-ligand complexes based on the average RMSD of the ligands. RMSD of the ligands < 1.5 Å indicates a stable complex; RMSD > 1.5 Å indicates an unstable complex. There is no statistically significant relationship between the activity of the ligands and whether their RMSD is below or above 1.5 Å (Chi-square test, p > 0.05); (b) Percent complexes in which the Ab-loop remains closed or opens. The Ab-loop is considered to be in its closed conformation if its average RMSD is equal to or lower than the average RMSD of the Ab-loop in the control inhibitors’ complexes (RMSD < 1.5 Å) and in its open conformation if its mobility is increased above these values (RMSD > 1.5 Å). The conformational mobility of the Ab-loop is significantly related to the ligand potency (Chi-square test, p < 0.05); (c) Percent complexes with either an equal or decreased (stable) or increased (unstable) average RMSD of Myr-CoA relative to the NMT complexes of IMP-1088 and DDD85646. The stability of the Myr-CoA complex with NMT is significantly related to the potency of the ligands (Chi-square test, p = 0.001); (d) Percent complexes with equal or decreased (stable) or increased (unstable) average RMSD of NMT protein relative to the complexes of the control NMT inhibitors. The dynamics of the NMT protein are significantly related to the potency of the ligands (Chi-square test, p < 0.001).
Figure 7
Figure 7
Conformational changes induced by binding of ligands to HsNMT1 based on MD simulations; (ad) RMSD of the heavy atoms of the Ab-loop, Myr-CoA, or NMT protein during the time course of MD simulations for the NMT complexes with IMP-1088, DDD85646, and the 24 ligands (compound 3 to compound 26, the legend on the right). RMSD values in the IMP-1088 complexes are indicated in black. The up arrow indicates complexes with increased dynamics (RMSD) compared to the NMT complex of IMP-1088; the down arrow shows complexes with decreased mobility of the indicated Y-axis parameters; (a) The potent NMT inhibitors IMP-1088 and DDD85646 lock the Ab-loop in a closed conformation during the entire duration of MD simulations, RMSD < 1.5 Å; (b) RMSD of the Ab-loop; (c) RMSD of Myr-CoA; (d) RMSD of NMT protein; (eh) Ab-loop opening and displacement of Myr-CoA during MD simulation of selected NMT-ligand complexes. Structural superimposition of the frames at the beginning (0 ns) and the end (1000 ns) of the MD simulations is shown. In time 0, the ligand is shown in magenta, the Ab-loop in yellow, and Myr-CoA in light blue; in time point 1000 ns, the ligand is shown in cyan, the Ab-loop in orange, Myr-CoA in wheat, and R255 is in blue; (e) In the HsNMT1: IMP-1088 complex, the Ab-loop remains closed, and the cofactor is confined to its binding pocket; (f) In the HsNMT1: compound 18 complex, the Ab-loop opens, leading to the formation of a salt bridge between R255 and D184; (g) In the HsNMT1: compound 24 complex, the Ab-loop opens, and the ligand is completely displaced from the binding site; (h) In the HsNMT1: compound 12 complex, the Ab-loop remains closed, but Myr-CoA is partially displaced from its binding pocket.
Figure 8
Figure 8
Predicting NMT inhibitor potency based on MD simulations. (a) All 24 ligands with weak activity display instability of at least one of the depicted conformational elements compared to the control NMT inhibitors; (b) The percent complexes with increased RMSDs of the heavy atoms of the Ab-loop, Myr-CoA, the entire NMT protein, or either of them, compared to DDD85646 and IMP-1088, are shown in blue (unstable); the percent compound complexes with RMSDs of the indicated parameters lower than of the control NMT inhibitors are shown in orange (stable). These distributions are significantly related to the potency of the ligands (Chi-square test, p-values are shown on top of the bars); (c) The score—the sum of RMSD values of the Ab-loop, Myr-CoA, and the NMT protein for each of the ligand complexes, unambiguously identifies the potent NMT inhibitors DDD85646 and IMP-1088 (blue diamonds) (Chi-square test, p < 0.001); (d) The score is significantly inversely correlated with the potency of the compounds (logIC50) (nonlinear fit, R2 = 0.9796). All compounds with IC50 < 100 µM (compounds 1 to 9, Table 1) were used to create the graph. IMP-1088 and DDD85646 are correctly identified as the most potent and second-most potent compounds, respectively. Compound 3 is next in potency and is the best hit from the virtual screening with an IC50 = 14 µM (Table 1).
Figure 9
Figure 9
Competitive inhibition vs. ligand entrapment (a) A model of competitive inhibition: the binding site is accessible, and the inhibitors compete with the substrate based on the change in free binding energy that arises from their interaction; (b) A model of ligand entrapment: the enzyme can adopt open and closed conformations related to different steps of the catalytic process (Figure S9). Inhibitor potency is determined by the ability of the ligand to lock the enzyme in its closed conformation, preventing the accessibility of the substrate to the catalytic center. The enzyme molecule is shown in black, the ligands in red and orange, and the cofactor Myr-CoA in blue. Note that ligand potency varies depending on the inhibition model. The red ligand demonstrates low potency in model (a) but high potency in model (b), whereas the orange ligand shows low potency in both models but exhibits either higher activity in (a) or lower activity in (b) compared to the red ligand.

References

    1. Meng X.Y., Zhang H.X., Mezei M., Cui M. Molecular docking: A powerful approach for structure-based drug discovery. Curr. Comput. Aided Drug Des. 2011;7:146–157. doi: 10.2174/157340911795677602. - DOI - PMC - PubMed
    1. Brooijmans N., Kuntz I.D. Molecular recognition and docking algorithms. Annu. Rev. Biophys. Biomol. Struct. 2003;32:335–373. doi: 10.1146/annurev.biophys.32.110601.142532. - DOI - PubMed
    1. de Ruyck J., Brysbaert G., Blossey R., Lensink M.F. Molecular docking as a popular tool in drug design, an in silico travel. Adv. Appl. Bioinform. Chem. AABC. 2016;9:1–11. doi: 10.2147/AABC.S105289. - DOI - PMC - PubMed
    1. Chen Y.C. Beware of docking! Trends Pharmacol. Sci. 2015;36:78–95. doi: 10.1016/j.tips.2014.12.001. - DOI - PubMed
    1. Pantsar T., Poso A. Binding Affinity via Docking: Fact and Fiction. Molecules. 2018;23:1899. doi: 10.3390/molecules23081899. - DOI - PMC - PubMed

MeSH terms

Substances

LinkOut - more resources