. 2023 Jul 20;24(14):11704.
doi: 10.3390/ijms241411704.

Silver Ions Inhibit Bacterial Movement and Stall Flagellar Motor

Affiliations

Silver Ions Inhibit Bacterial Movement and Stall Flagellar Motor

Benjamin Russell et al. Int J Mol Sci. .

Abstract

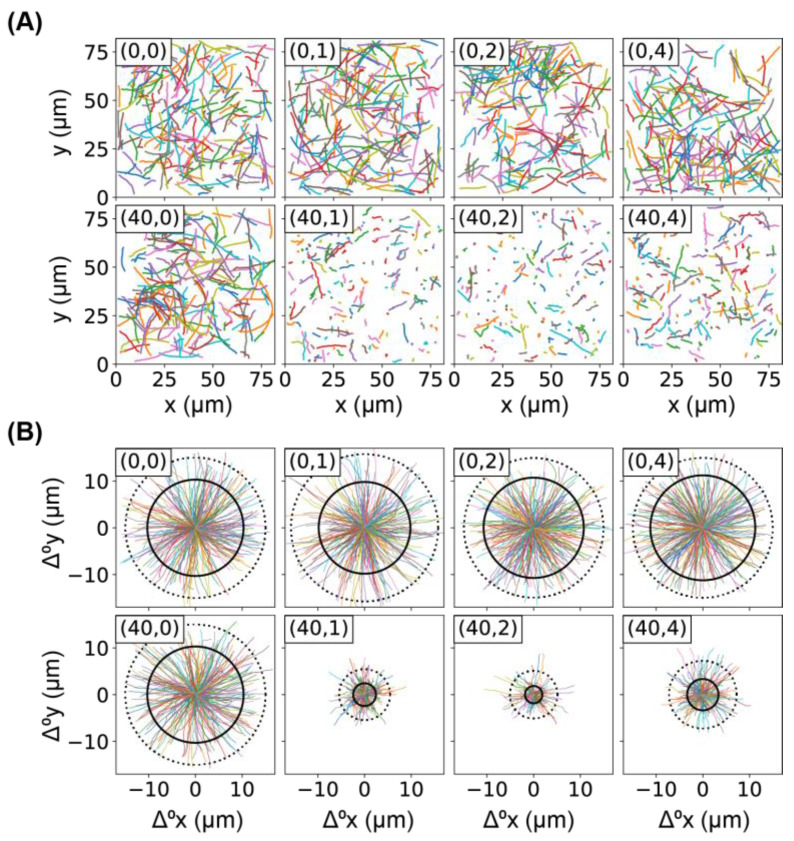
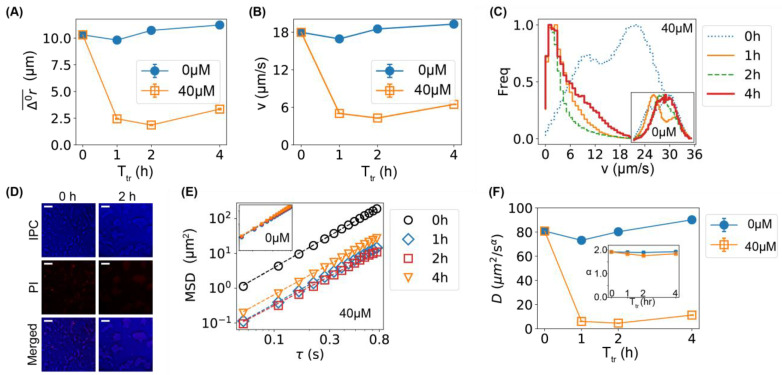
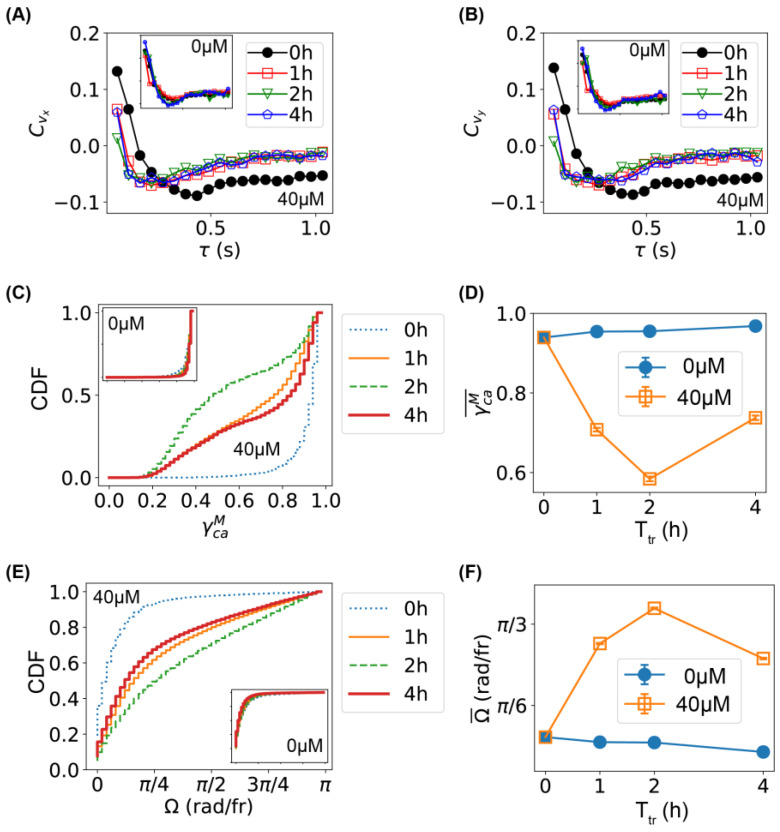
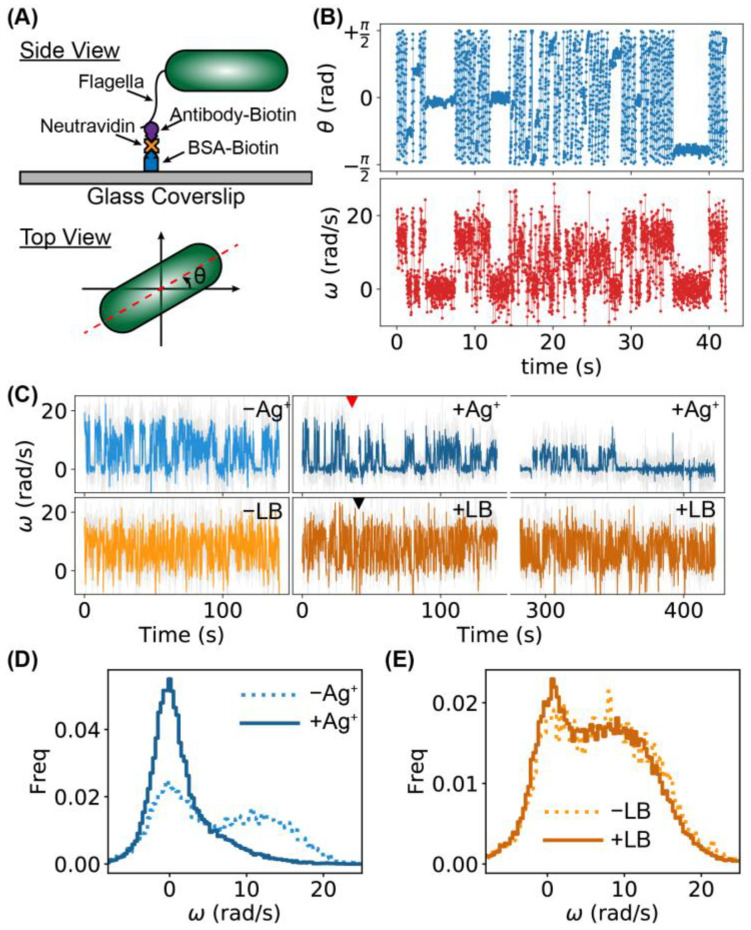
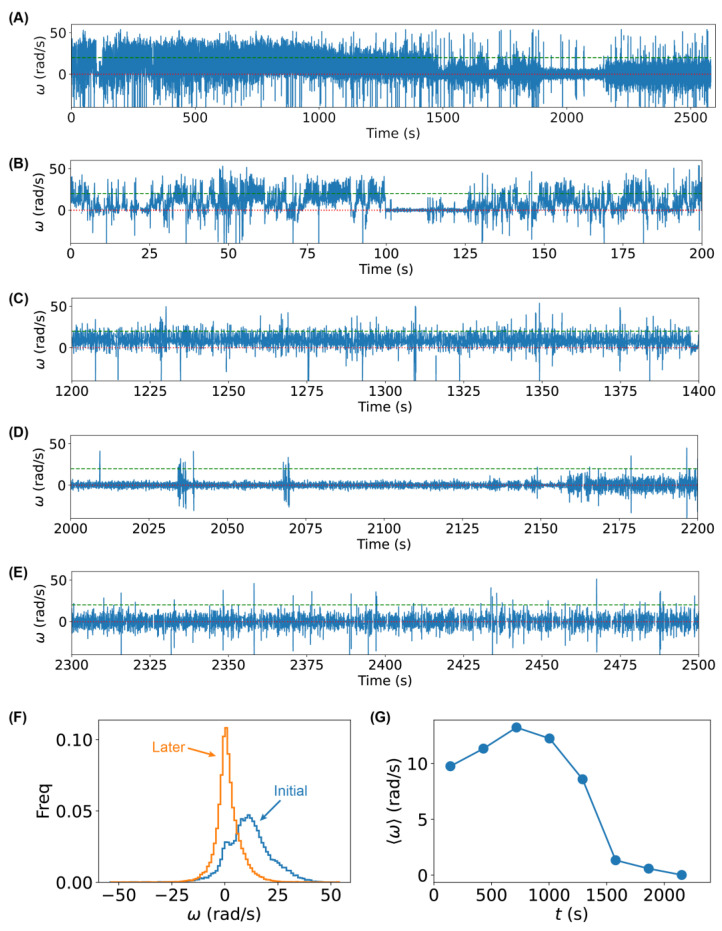
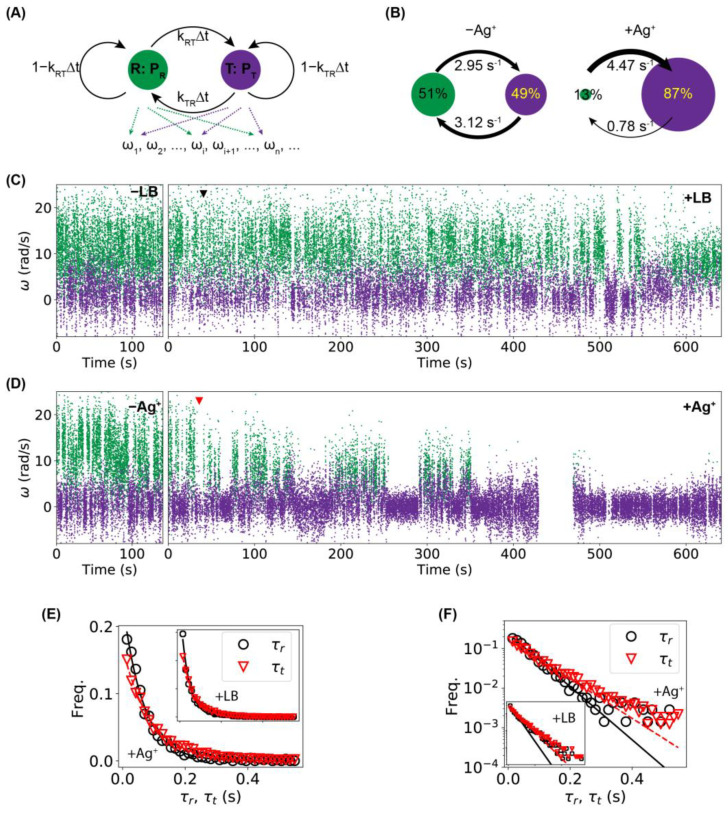
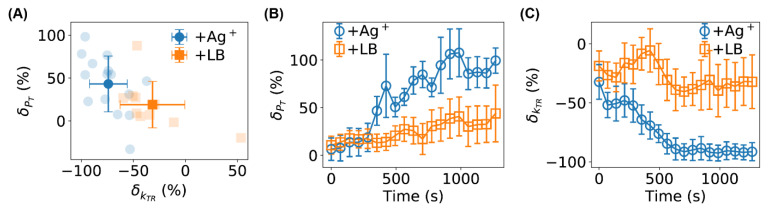
Silver (Ag) in different forms has been gaining broad attention due to its antimicrobial activities and the increasing resistance of bacteria to commonly prescribed antibiotics. However, various aspects of the antimicrobial mechanism of Ag have not been understood, including how Ag affects bacterial motility, a factor intimately related to bacterial virulence. Here, we report our study on how Ag+ ions affect the motility of E. coli bacteria using swimming, tethering, and rotation assays. We observed that the bacteria slowed down dramatically by >70% when subjected to Ag+ ions, providing direct evidence that Ag+ ions inhibit the motility of bacteria. In addition, through tethering and rotation assays, we monitored the rotation of flagellar motors and observed that the tumbling/pausing frequency of bacteria increased significantly by 77% in the presence of Ag+ ions. Furthermore, we analyzed the results from the tethering assay using the hidden Markov model (HMM) and found that Ag+ ions decreased bacterial tumbling/pausing-to-running transition rate significantly by 75%. The results suggest that the rotation of bacterial flagellar motors was stalled by Ag+ ions. This work provided a new quantitative understanding of the mechanism of Ag-based antimicrobial agents in bacterial motility.

Keywords: E. coli; antibiotics; hidden Markov model; motility; rotation; tethering assay.


Conflict of interest statement

The authors declare no conflict of interest.

Figures

Figure 1
Figure 1
Motion of bacteria in the absence and presence of Ag+ ions. (A) Trajectories of bacteria, untreated or treated by Ag+ ions at 40 µM. Each sub-figure contains 200 randomly chosen trajectories and is labeled by (cAg, Ttr), where cAg is the concentration of Ag+ ions and Ttr is the treatment/incubation time. (B) Rose graphs of the first 12 frames of trajectories of bacteria, untreated or treated by Ag+ ions at 40 µM. Each sub-figure is labeled similarly as in (panel A). Under each condition, 300 randomly chosen examples of the trajectories were shown in color, while the mean and 90th percentile of the displacements of the first 12 frames of all the trajectories were shown as solid and dotted circles, respectively.
Figure 2
Figure 2
Lower motility of bacteria caused by Ag+ ions. (A) The dependence of the mean displacements (Δ0r¯) of the first 12 frames of all trajectories of bacteria on incubation/treatment time in the absence (0 µM) and presence of Ag+ ions (40 µM). (B) The dependence of the mean bacterial velocity on incubation/treatment time in the absence (0 µM) and presence of Ag+ ions (40 µM). (C) Distributions of bacterial velocities in the presence of Ag+ ions at 40 µM for 0, 1, 2, and 4 h. Inset: the corresponding result for untreated bacteria (0 µM). The axes of the inset are the same as the main figure. (D) Cell-viability assay based on propidium iodide (PI) staining for untreated (0 h, left column) and treated (2 h, right column) bacteria. Top: inverted phase-contrast (IPC) images; middle: fluorescence images due to PI staining; bottom: merged IPC/PI images. Scale bar = 16 µm. (E) Log–log plot of mean-square displacements (MSDs) vs. lag time (τ) for trajectories of treated bacteria by Ag+ ions at 40 µM for 0, 1, 2, and 4 h. Inset: the corresponding result for untreated bacteria (0 µM). (F) Dependencies of the generalized diffusion coefficient D and the anomalous scaling exponent α (inset) on the incubation/treatment time Ttr.
Figure 3
Figure 3
Characterization of bacterial movement and comparison between untreated and treated bacteria. (A,B) Autocorrelation of velocities (A: vx; B: vy) for bacteria treated with Ag+ ions at 40 µM for 0, 1, 2, and 4 h. Insets: the corresponding results for untreated bacteria. (C) Cumulative distribution function (C,D,F) of the maximum chord-to-arc ratio (γCAM) for the trajectories of bacteria untreated (0 h) or treated with 40 μM Ag+ ions for 1, 2, and 4 h. (D) Dependence of the mean of γCAM on treatment time. (E) CDF of the changing rate of swimming directions (Ω) for bacteria untreated (0 h) or treated with 40 μM Ag+ ions for 1, 2, and 4 h. (F) Dependence of the mean of Ω on treatment time.
Figure 4
Figure 4
Tethering assay for investigating the running and tumbling/pausing of individual bacteria. (A) Tethering of a bacterium on a glass coverslip (side view) and orientation of a bacterium θ (top view). (B) Examples of trajectories of orientation θ and angular velocity ω of a bacterium for 3000 frames (or 42.3 s). (C) Examples of ω-trajectories for two bacteria. The top one was treated (blue curves) with Ag+ ions; the red arrow indicates the time of adding Ag+ ions. The bottom trajectories (orange curves) were for a bacterium without treatment. LB medium was added into the sample at the time indicated by the black arrow. (D) Distributions of ω for a bacterium treated by Ag+ ions: pre-Ag+ (dotted) and post-Ag+ (solid). (E) Distributions of ω for an untreated bacterium: pre-LB (dotted) and post-LB (solid).
Figure 5
Figure 5
Higher frequency of tumbling/pausing caused by Ag+ ions using untethered rotation assay. (A) Angular velocity ω trajectory of 2600 s of a single bacterium with flagellar filaments shortened by shearing after adding Ag+ ions to the solution at time = 0 s. (BE) Zoom-in of the angular velocity trajectory in different ranges of treatment time. Red dotted lines and green dashed lines highlight the values of 0 and 20 rad/s, respectively. (F) Distributions of the angular velocity ω for the same bacterium for the initial ~1300 s (blue) or later ~1300 s (orange) after adding Ag+ ions. (G) Mean angular velocity ω (averaged over ~287 s) as a function of treatment time.
Figure 6
Figure 6
Hidden Markov model (HMM) analysis. (A) The hidden Markov model with two states (running (R) vs. tumbling/pausing (T)), which emit observations of angular velocities ωi. The probabilities for the system to be in the running (green) and tumbling/pausing (purple) states are PR and PT, respectively. The transition probabilities between the two states are PRT=kRTΔt and PTR=kTRΔt, where kRT and kTR are the corresponding transition rates and Δt is the time interval between observations. (B) Predicted parameters (PR, PT, kRT, and kTR) from the HMM analysis for pre-Ag+ and post-Ag+ ω-trajectories of the bacterium in the top row of Figure 4C. (C,D) Predictions of states from the fitted/trained HMM model for the angular velocity (ω) trajectories for (C) an untreated bacterium and (D) a Ag+-treated bacterium. Green and purple colors indicate the running and tumbling/pausing states, respectively. The red and black arrows indicate the time of adding Ag+ ions or LB medium, respectively. (E,F) Distributions of the dwell times (τr for running dwell time and τt for tumbling/pausing dwell time) from the untreated (insets) and Ag-treated bacteria shown in panels (C) and (D) in (E) linear scale or (F) log-linear scale. Solid and dashed lines are fitted exponential curves.
Figure 7
Figure 7
(A) Statistics of the relative changes in PT and kTR for 10 untreated (orange squares) and 15 Ag+-treated bacteria (blue circles). Error bars stand for standard deviation. (B,C) Time dependencies of the relative changes in (B) PT and (C) kTR for untreated (orange squares) and Ag+-treated (blue circles) bacteria. Error bars stand for the standard error of the mean.

References

    1. Davies J., Davies D. Origins and Evolution of Antibiotic Resistance. Microbiol. Mol. Biol. Rev. 2010;74:417–433. doi: 10.1128/MMBR.00016-10. - DOI - PMC - PubMed
    1. Blair J.M.A., Webber M.A., Baylay A.J., Ogbolu D.O., Piddock L.J.V. Molecular Mechanisms of Antibiotic Resistance. Nat. Rev. Microbiol. 2015;13:42–51. doi: 10.1038/nrmicro3380. - DOI - PubMed
    1. CDC . Antibiotic Resistance Threats in the United State. Centers for Disease Control and Prevention; Atlanta, GA, USA: 2019.
    1. Allen H.K., Trachsel J., Looft T., Casey T.A. Finding Alternatives to Antibiotics. Ann. N. Y. Acad. Sci. 2014;1323:91–100. doi: 10.1111/nyas.12468. - DOI - PubMed
    1. François B., Jafri H.S., Bonten M. Alternatives to Antibiotics. Intensive Care Med. 2016;42:2034–2036. doi: 10.1007/s00134-016-4339-y. - DOI - PubMed

LinkOut - more resources