. 2023 Jul 22;24(14):11800.
doi: 10.3390/ijms241411800.

A New Role for Yeast Cells in Health and Nutrition: Antioxidant Power Assessment

Affiliations

A New Role for Yeast Cells in Health and Nutrition: Antioxidant Power Assessment

Thomas Gosselin-Monplaisir et al. Int J Mol Sci. .

Abstract

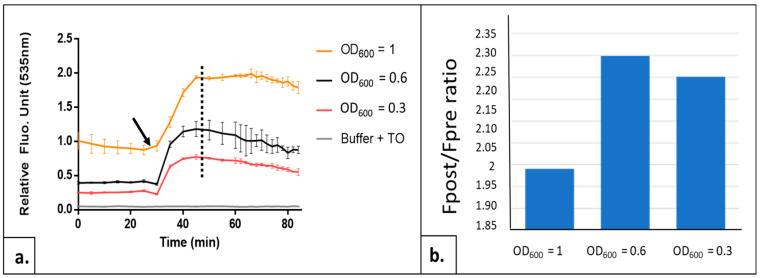
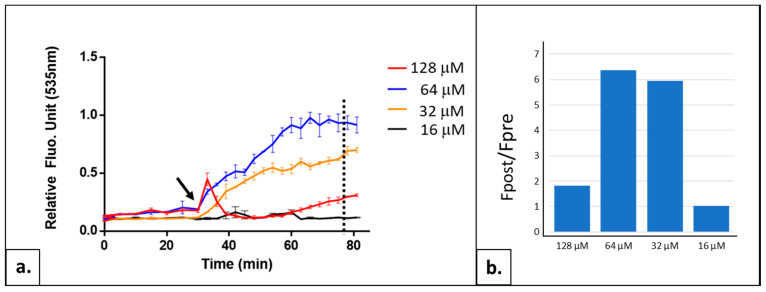
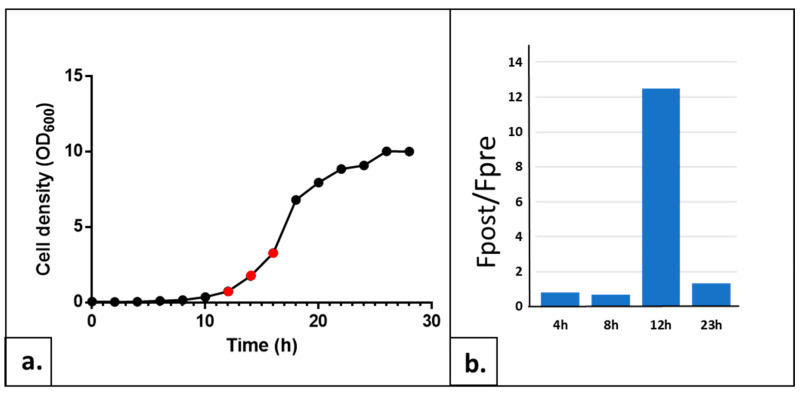
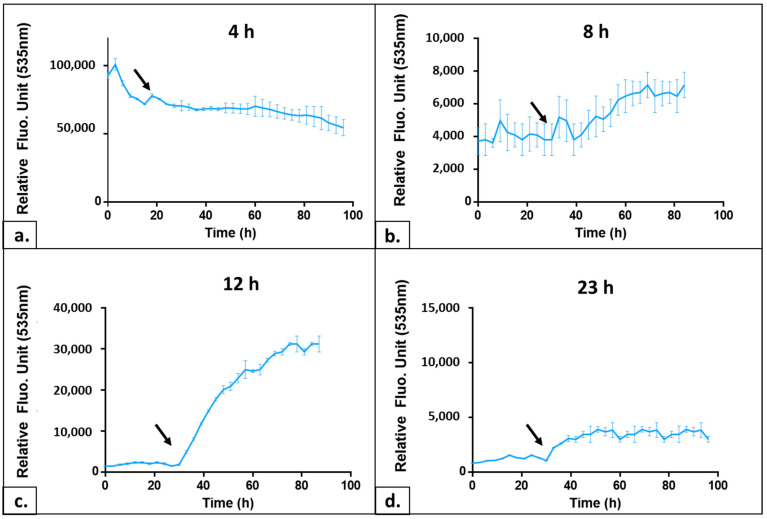
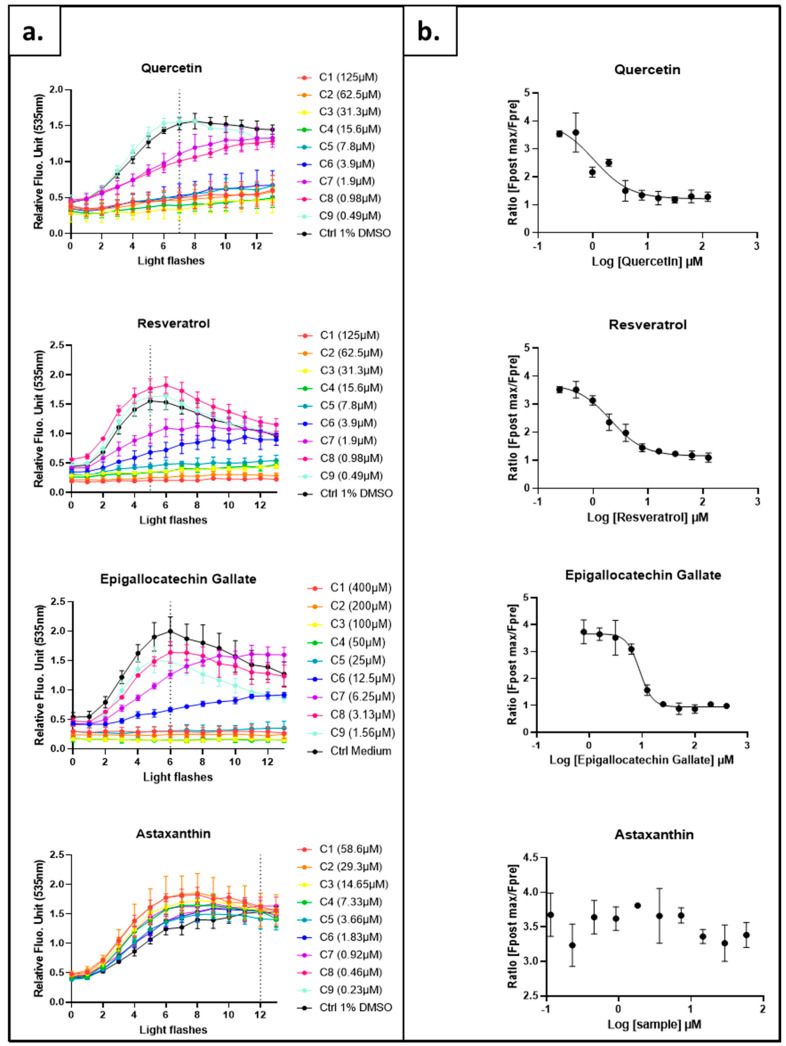
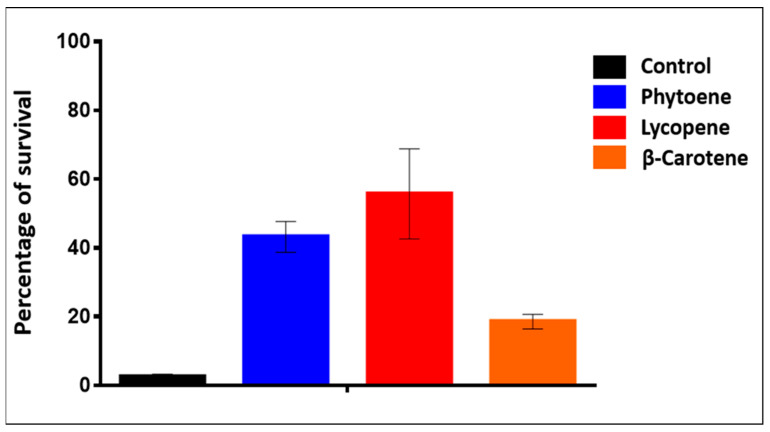
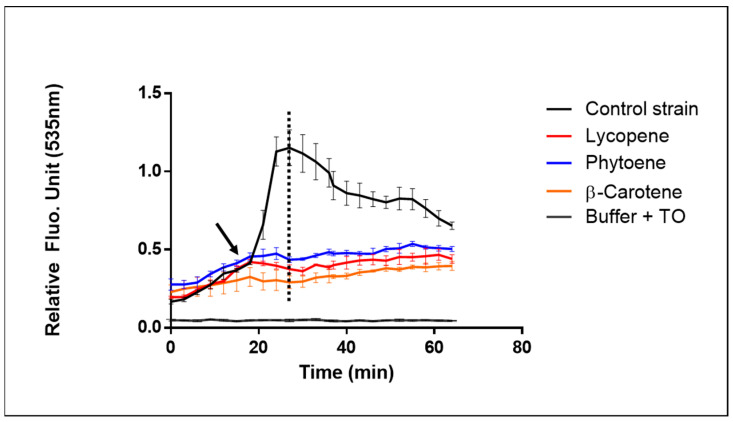
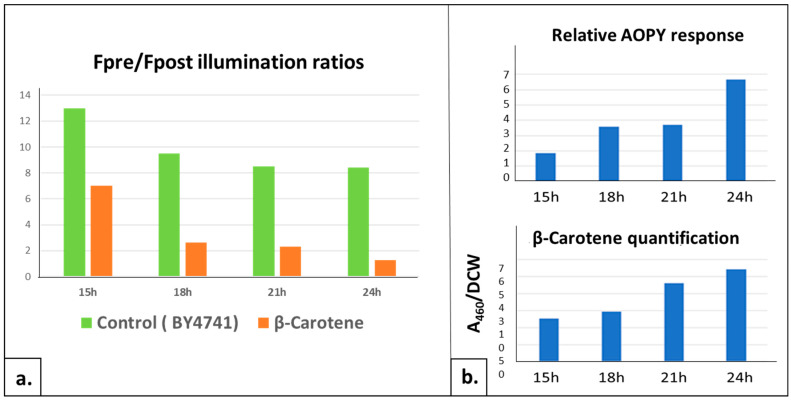
As the use of antioxidant compounds in the domains of health, nutrition and well-being is exponentially rising, there is an urgent need to quantify antioxidant power quickly and easily, ideally within living cells. We developed an Anti Oxidant Power in Yeast (AOPY) assay which allows for the quantitative measurement of the Reactive Oxygen Species (ROS) and free-radical scavenging effects of various molecules in a high-throughput compatible format. Key parameters for Saccharomyces cerevisiae were investigated, and the optimal values were determined for each of them. The cell density in the reaction mixture was fixed at 0.6; the concentration of the fluorescent biosensor (TO) was found to be optimal at 64 µM, and the strongest response was observed for exponentially growing cells. Our optimized procedure allows accurate quantification of the antioxidant effect in yeast of well-known antioxidant molecules: resveratrol, epigallocatechin gallate, quercetin and astaxanthin added in the culture medium. Moreover, using a genetically engineered carotenoid-producing yeast strain, we realized the proof of concept of the usefulness of this new assay to measure the amount of β-carotene directly inside living cells, without the need for cell lysis and purification.

Keywords: LUCS; antioxidant; biosensor; carotenoids; synthetic biology; yeasts.


Conflict of interest statement

C.F. declares being inventor of the patent EP2235505 covering LUCS method. C.F., M.R, and A.F are employees of Anti Oxidant Power—AOP, the start-up company which operates the patent. The other authors declare no conflict of interest.

Figures

Figure 1
Figure 1
Influence of cell density on AOPY test sensitivity. (a) Kinetics of TO fluorescence obtained with AOPY test on BY 4741 yeast strain collected in exponential growth phase and diluted at different cell densities (measured by optical density at 600 nm). Yellow curve: OD600 = 1, black curve: OD600 = 0.6 and orange curve: OD600 = 0.3; gray curve = control without cells (buffer + TO). Black arrow indicates the starting point of illuminations. From this point, each illumination is followed by a fluorescence measurement. Data are the mean of 3 independent experiments, with each sample in 3 replicates. (b) Fpost/Fpre-illumination ratios for these same cell densities. Fpost = fluorescence value at flash number indicated as dotted line on graph a (corresponding to the highest control value). Fpre = fluorescence value before the first light flash.
Figure 2
Figure 2
AOPY profiles and Fpost/Fpre-illumination ratios for different TO concentrations. (a) Kinetics of TO fluorescence of BY4741 cells collected in exponential growth phase, diluted at OD600 0.6 and treated with 16, 32, 64 or 128 μM of TO. Black arrow: starting point of illumination. Experiments were carried out twice in triplicate with similar results. (b) Ratio of Fpost/Fpre-illumination plateau is compared for these four TO concentrations. Fpost = fluorescence value at flash number indicated as dotted line on graph A (corresponding to the highest control value). Fpre = fluorescence value before the first light flash. Data are the mean of two independent experiments, with each sample in triplicate.
Figure 3
Figure 3
Influence of the growth phase of yeast cells on AOPY test sensitivity. (a) Growth curve of BY4741 wt strain started in YPD medium from the −80° frozen cell aliquots established by measuring the optical density at 600 nm every 2 h for a total of 28 h. Red points indicate the culture time with the best AOP response (see below). (b) Fpost/Fpre-illumination ratios of the AOPY test at four chosen time points of the culture representative of the lag phases (4 h and 8 h) and exponential growth phases (12 h) and (23 h).
Figure 4
Figure 4
Influence of the growth phase on AOPY fluorescence profiles. Kinetics of TO fluorescence in AOPY assay using cells collected in different phases of the cell growth curve (see Figure 3): (a) after 4 h of culture, i.e., lag phase; (b) after 8 h, end of lag phase; (c) after 12 h, exponential growth; (d) after 23 h, i.e., stationary phase. Black arrow: starting point of illumination. RFU scales are different for a better adaptation to each profile.
Figure 5
Figure 5
Comparison of standard antioxidant profiles and dose–response curves by AOPY in BY4741 strain. (a) Kinetics of fluorescence obtained in exponential growth phase (19 h) for each tested concentration using optimized light application (24 mJ/cm2), TO concentration (64 µM) and OD590 nm (0.6). (b) Dose–response curves measured by fluorescence ratio. Fpost = fluorescence value at flash number indicated as dotted line on graph A (corresponding to the highest control value). Fpre = fluorescence value before the first light flash. All experiments were carried out twice in triplicate with similar results.
Figure 6
Figure 6
Viability test of yeast cells upon AOPY assay. Histograms represent the percentage of yeast cell survival (able to form colonies when plated on complete solid medium; see Section 4) of four yeast strains after the incubation with Thiazole Orange and illumination flash sequence of AOPY assay. Black = Control strain BY4741, Blue = Phytoene-producing strain, Red = Lycopene-producing strain, Orange = β-carotene-producing strain.
Figure 7
Figure 7
Effect of intracellularly produced carotenoids on AOPY response. AOPY assay was conducted on three different carotenoid-producing yeast strains: black curve = Control strain BY4741 blue curve = Phytoene-producing yeast strain, red curve = Lycopene-producing strain, orange curve = β-carotene-producing yeast strain, gray curve = no cells (buffer + TO). Black arrow indicates the starting point of illumination. Dotted line indicates the highest control value used to calculate Fpost/Fpre-illumination fluorescence ratio. Experiment was carried out three times with similar results, with each sample in triplicate.
Figure 8
Figure 8
Correlation of intracellularly produced β-Carotene amount and AOPY response. β-Carotene-producing yeast strain and control strain (BY4741) were submitted to AOPY test and parallel β-carotene quantification at different growth time points. (a) AOPY signals (Fpost/Fpre-illumination ratios) at 15 h, 18 h, 21 h, 24 h of BY4741 (green columns) and β-carotene-producing (orange columns) strains. (b) Relative effect: ratios between AOPY response level (Fpost/Fpre-illumination ratios) of β-carotene-producing strain and control strain BY4741 for each time point are represented as histograms (upper panel). Quantification of β-carotene by UV absorbance at 480 nm reported to corresponding dry cell weight (DCW) (lower panel).

Similar articles

Cited by

References

    1. Derick S., Gironde C., Perio P., Reybier K., Nepveu F., Jauneau A., Furger C. LUCS (Light-Up Cell System), a universal high throughput assay for homeostasis evaluation in live cells. Sci. Rep. 2017;7:18069. doi: 10.1038/s41598-017-18211-2. - DOI - PMC - PubMed
    1. Gironde C., Rigal M., Dufour C., Furger C. AOP1, a new live cell assay for the direct and quantitative measure of intracellular antioxidant effects. Antioxidants. 2020;9:471. doi: 10.3390/antiox9060471. - DOI - PMC - PubMed
    1. Furger C., Gironde C., Rigal M., Dufour C., Guillemet D. Cell-based antioxidant properties and synergistic effects of natural plant and algal extracts pre and post intestinal barrier transport. Antioxidants. 2022;11:565. doi: 10.3390/antiox11030565. - DOI - PMC - PubMed
    1. Dufour C., Villa-Rodriguez J.A., Furger C., Lessard-Lord J., Gironde C., Rigal M., Badr A., Desjardins Y., Guyonnet D. Cellular antioxidant effect of an aronia extract and its polyphenolic fractions enriched in proanthocyanidins, phenolic acids, and anthocyanins. Antioxidants. 2022;11:1561. doi: 10.3390/antiox11081561. - DOI - PMC - PubMed
    1. Ostergaard S., Olsson L., Nielsen J. Metabolic engineering of Saccharomyces cerevisiae. Microbiol. Mol. Biol. Rev. 2000;64:34–50. doi: 10.1128/MMBR.64.1.34-50.2000. - DOI - PMC - PubMed

MeSH terms