. 2023 Jul 19;16(14):5083.
doi: 10.3390/ma16145083.

Interplay of Oxidative Stress, Inflammation, and Autophagy in RAW 264.7 Murine Macrophage Cell Line Challenged with Si/SiO2 Quantum Dots

Affiliations

Interplay of Oxidative Stress, Inflammation, and Autophagy in RAW 264.7 Murine Macrophage Cell Line Challenged with Si/SiO2 Quantum Dots

Loredana Stanca et al. Materials (Basel). .

Abstract

Quantum dots (QDs) with photostable fluorescence are recommended for imaging applications; however, their effect on living cells is incompletely understood. We aimed to elucidate the RAW 264.7 murine macrophage cell line's response to the Si/SiO2 QDs challenge. Cells were exposed to 5 and 15 μg/mL Si/SiO2 QDs for 6 h, 12 h, and 24 h. Cell metabolic activity and viability were assessed by MTT, live/dead, and dye-exclusion assays. Oxidative stress and membrane integrity were assessed by anion superoxide, malondialdehyde, and lactate dehydrogenase activity evaluations. Antioxidative enzyme activities were analyzed by kinetic spectrophotometric methods. Cytokines were analyzed with an antibody-based magnetic bead assay, PGE2 was assessed by ELISA, and Nrf-2, Bcl-2, Beclin 1, and the HSPs were analyzed by western blot. Autophagy levels were highlighted by fluorescence microscopy. The average IC50 dose for 6, 12, and 24 h was 16.1 ± 0.7 μg/mL. Although glutathione S-transferase and catalase were still upregulated after 24 h, superoxide dismutase was inhibited, which together allowed the gradual increase of malondialdehyde, anion superoxide, nitric oxide, and the loss of membrane integrity. G-CSF, IL-6, TNF-α, MIP-1β, MCP-1, Nrf-2, PGE2, and RANTES levels, as well as autophagy processes, were increased at all time intervals, as opposed to caspase 1 activity, COX-2, HSP60, and HSP70, which were only upregulated at the 6-h exposure interval. These results underscore that Si/SiO2 QDs possess significant immunotoxic effects on the RAW 264.7 macrophage cell line and stress the importance of developing effective strategies to mitigate their adverse impact.

Keywords: RAW 264.7; Si/SiO2 QDs; antioxidative enzymes; autophagy; cell membrane damage; cytokines; heat shock proteins; immunotoxicity; inflammatory response; oxidative stress.


Conflict of interest statement

The authors declare no conflict of interest.

Figures

Figure 1
Figure 1
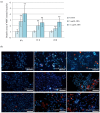
Cell proliferation and viability of murine RAW 264.7 macrophages exposed to Si/SiO2 QDs. (a) The cell metabolic activity revealed by MTT assay; (b) dose-response curves highlighting the IC50 doses; (c) the number of live cells estimated by LIVE/DEAD assay; (d) the number of dead cells estimated by LIVE/DEAD assay; (e) cell viability calculated from cell counts obtained from integration of specific fluorescence signals in LIVE/DEAD fluorescence micrographs; (f) representative examples of fluorescence micrographs of LIVE/DEAD stained RAW 264.7 cells in culture, exposed to 5 and 15 μg/mL QDs for 6, 12, and 24 h, along with the corresponding controls, with live cells stained in green and dead cells stained in red. Bar represents 200 μm; (g) trypan blue dye exclusion live assay cell counts; (h) trypan blue dye exclusion live assay cell counts; (i) cell viability calculated based on trypan blue dye exclusion assay. Data are presented as means ± SD. A student’s t-test was calculated to assess statistical significance relative to controls: * p ≤ 0.05, ** p ≤ 0.01, *** p ≤ 0.001.
Figure 2
Figure 2
Oxidative stress indicators in RAW 264.7 cells exposed to Si/SiO2 QDs. (a) Extracellular LDH activity; (b) ROS levels; (c) MDA levels; and (d) NO levels in whole cell lysates. Data are presented as means ± SD. A student’s t-test was calculated to assess statistical significance relative to controls: * p ≤ 0.05, ** p ≤ 0.01, *** p ≤ 0.001.
Figure 3
Figure 3
Inflammatory-related indicators in RAW 264.7 macrophages exposed to Si/SiO2 QDs. (a) Relative COX-2 enzyme activity level; (b) relative PGE2 levels; (c) relative caspase 1 activity levels. Data represent means ± SD. Statistically significant differences (student’s t-test) relative to control are indicated by * p ≤ 0.05; ** p ≤ 0.01.
Figure 4
Figure 4
Heat-plot graph depicting the relative fold changes of a panel of 23 cytokines in QD-exposed RAW 264.7 macrophages relative to controls. The color key is shown on the right. All fold changes greater than 10-fold are represented by the same color. OOR > out of range, higher. The image was constructed based on the information presented in Supplementary Table S1, where the absolute values, SD, and statistical significance of the fold changes are available.
Figure 5
Figure 5
Modulation of antioxidative enzymes in RAW 264.7 cells exposed to Si/SiO2 QDs. (a) Relative GST activity levels; (b) relative GPX levels; (c) relative CAT levels; (d) relative SOD levels. Data are relative to control and represent means ± SD. Data represent means ± SD. Statistically significant differences (student’s t-test) relative to control are indicated by * p ≤ 0.05; ** p ≤ 0.01; *** p ≤ 0.001.
Figure 6
Figure 6
Modulation of key proteins in the stress response pathways in RAW 264.7 cells exposed to Si/SiO2 QDs. (a) representative immunoblots; densitometric analysis revealing the relative protein expression levels of (b) Nrf-2 (98 kDa); (c) Nrf-2 (57 kDa); (d) Bcl-2; (e) Beclin-1; (f) HSC70; (g) HSP70; (h) HSP60; and (i) HSP90. Data are relative to control and represent means ± SD. Data represent means ± SD. Statistically significant differences (student’s t-test) relative to control are indicated by * p ≤ 0.05; ** p≤ 0.01; *** p ≤ 0.001.
Figure 7
Figure 7
Autophagy levels in RAW 264.7 cells exposed to Si/SiO2 QDs. (a) quantification of MDC-stained vacuoles from specific fluorescence signals from fluorescence micrographs. Data represent means ± SD. A student’s t-test was calculated to assess statistical significance relative to controls: ** p ≤ 0.01. (b) representative fluorescence microscopy images of MDC- (in blue) and PI-stained (in red) RAW 264.7 cells exposed to Si/SiO2 QDs. The bar represents 50 μm.

References

    1. Bon P., Cognet L. On Some Current Challenges in High-Resolution Optical Bioimaging. ACS Photonics. 2022;9:2538–2546. doi: 10.1021/acsphotonics.2c00606. - DOI - PMC - PubMed
    1. Ding F., Feng J., Zhang X., Sun J., Fan C., Ge Z. Responsive optical probes for deep-tissue imaging: Photoacoustics and second near-infrared fluorescence. Adv. Drug Deliv. Rev. 2021;173:141–163. - PubMed
    1. Yoon S., Cheon S.Y., Park S., Lee D., Lee Y., Han S., Kim M., Koo H. Recent advances in optical imaging through deep tissue: Imaging probes and techniques. Biomater. Res. 2022;26:57. doi: 10.1186/s40824-022-00303-4. - DOI - PMC - PubMed
    1. Ji X., Peng F., Zhong Y., Su Y., He Y. Fluorescent quantum dots: Synthesis, biomedical optical imaging, and biosafety assessment. Colloids Surf. B Biointerfaces. 2014;124:132–139. - PubMed
    1. Smith B.R., Gambhir S.S. Nanomaterials for In Vivo Imaging. Chem. Rev. 2017;117:901–986. - PubMed