Clinical Blood Metabogram: Application to Overweight and Obese Patients
- PMID: 37512504
- PMCID: PMC10386708
- DOI: 10.3390/metabo13070798
Clinical Blood Metabogram: Application to Overweight and Obese Patients
Abstract
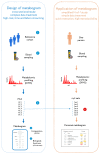
Recently, the concept of a mass spectrometric blood metabogram was introduced, which allows the analysis of the blood metabolome in terms of the time, cost, and reproducibility of clinical laboratory tests. It was demonstrated that the components of the metabogram are related groups of the blood metabolites associated with humoral regulation; the metabolism of lipids, carbohydrates, and amines; lipid intake into the organism; and liver function, thereby providing clinically relevant information. The purpose of this work was to evaluate the relevance of using the metabogram in a disease. To do this, the metabogram was used to analyze patients with various degrees of metabolic alterations associated with obesity. The study involved 20 healthy individuals, 20 overweight individuals, and 60 individuals with class 1, 2, or 3 obesity. The results showed that the metabogram revealed obesity-associated metabolic alterations, including changes in the blood levels of steroids, amino acids, fatty acids, and phospholipids, which are consistent with the available scientific data to date. Therefore, the metabogram allows testing of metabolically unhealthy overweight or obese patients, providing both a general overview of their metabolic alterations and detailing their individual characteristics. It was concluded that the metabogram is an accurate and clinically applicable test for assessing an individual's metabolic status in disease.
Keywords: blood; clinical blood tests; diagnostics; mass spectrometry; metabogram; metabolomics; personalized metabolomics.
Conflict of interest statement
The authors declare no conflict of interest. The funders had no role in the design of the study; in the collection, analyses, or interpretation of the data; in the writing of the manuscript; or in the decision to publish the results.
Figures


Similar articles
-
Application of Clinical Blood Metabogram to Type 2 Diabetes Mellitus.Metabolites. 2024 Mar 18;14(3):168. doi: 10.3390/metabo14030168. Metabolites. 2024. PMID: 38535328 Free PMC article.
-
Linking Clinical Blood Metabogram and Gut Microbiota.Metabolites. 2023 Oct 19;13(10):1095. doi: 10.3390/metabo13101095. Metabolites. 2023. PMID: 37887420 Free PMC article.
-
Mass Spectrometric Blood Metabogram: Acquisition, Characterization, and Prospects for Application.Int J Mol Sci. 2023 Jan 15;24(2):1736. doi: 10.3390/ijms24021736. Int J Mol Sci. 2023. PMID: 36675249 Free PMC article.
-
Clinical metabolomics: current state and prospects in Russia.Biomed Khim. 2024 Sep;70(5):329-341. doi: 10.18097/PBMC20247005329. Biomed Khim. 2024. PMID: 39324197 Review.
-
Metabolomic Signature Between Metabolically Healthy Overweight/Obese and Metabolically Unhealthy Overweight/Obese: A Systematic Review.Diabetes Metab Syndr Obes. 2021 Mar 4;14:991-1010. doi: 10.2147/DMSO.S294894. eCollection 2021. Diabetes Metab Syndr Obes. 2021. PMID: 33692630 Free PMC article. Review.
Cited by
-
Application of Clinical Blood Metabogram to Type 2 Diabetes Mellitus.Metabolites. 2024 Mar 18;14(3):168. doi: 10.3390/metabo14030168. Metabolites. 2024. PMID: 38535328 Free PMC article.
-
Linking Clinical Blood Metabogram and Gut Microbiota.Metabolites. 2023 Oct 19;13(10):1095. doi: 10.3390/metabo13101095. Metabolites. 2023. PMID: 37887420 Free PMC article.
-
Application of clinical blood metabogram for diagnosis of early-stage Parkinson's disease: a pilot study.Front Mol Biosci. 2024 Aug 14;11:1407974. doi: 10.3389/fmolb.2024.1407974. eCollection 2024. Front Mol Biosci. 2024. PMID: 39206052 Free PMC article.
References
-
- Committee on the Review of Omics-Based Tests for Predicting Patient Outcomes in Clinical Trials. Board on Health Care Services. Board on Health Sciences Policy. Institute of Medicine . In: Evolution of Translational Omics: Lessons Learned and the Path Forward. Micheel C.M., Sharyl N.J., Omenn G.S., editors. National Academies Press; Washington, DC, USA: 2012. - PubMed
-
- Gurke R., Bendes A., Bowes J., Koehm M., Twyman R.M., Barton A., Elewaut D., Goodyear C., Hahnefeld L., Hillenbrand R., et al. Omics and Multi-Omics Analysis for the Early Identification and Improved Outcome of Patients with Psoriatic Arthritis. Biomedicines. 2022;10:2387. doi: 10.3390/biomedicines10102387. - DOI - PMC - PubMed
Grants and funding
LinkOut - more resources
Full Text Sources

