

Numerical Solution of the Electric Field and Dielectrophoresis Force of Electrostatic Traveling Wave System
- PMID: 37512658
- PMCID: PMC10384890
- DOI: 10.3390/mi14071347
Numerical Solution of the Electric Field and Dielectrophoresis Force of Electrostatic Traveling Wave System
Abstract
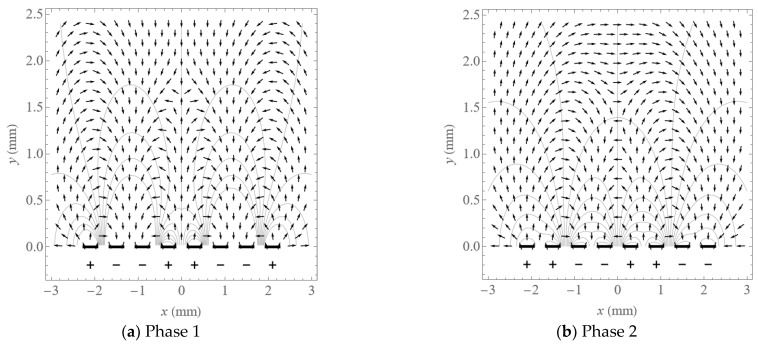
Electrostatic traveling wave (ETW) methods have shown promising performance in dust mitigation of solar panels, particle transport and separation in in situ space resource utilization, cell manipulation, and separation in biology. The ETW field distribution is required to analyze the forces applied to particles and to evaluate ETW design parameters. This study presents the numerical results of the ETW field distribution generated by a parallel electrode array using both the charge simulation method (CSM) and the boundary element method (BEM). A low accumulated error of the CSM is achieved by properly arranging the positions and numbers of contour points and fictitious charges. The BEM can avoid the inconvenience of the charge position required in the CSM. The numerical results show extremely close agreement between the CSM and BEM. For simplification, the method of images is introduced in the implementation of the CSM and BEM. Moreover, analytical formulas are obtained for the integral of Green's function along boundary elements. For further validation, the results are cross-checked using the finite element method (FEM). It is found that discrepancies occur at the ends of the electrode array. Finally, analyses are provided of the electric field and dielectrophoretic (DEP) components. Emphasis is given to the regions close to the electrode surfaces. These results provide guidance for the fabrication of ETW systems for various applications.
Keywords: boundary element method; cell manipulation and separation; charge simulation method; dielectrophoretic force; electric field calculation; electrostatic traveling wave; parallel electrodes.
Conflict of interest statement
The authors declare no conflict of interest.
Figures


Similar articles
-
Analytical solutions of ac electrokinetics in interdigitated electrode arrays: electric field, dielectrophoretic and traveling-wave dielectrophoretic forces.Phys Rev E Stat Nonlin Soft Matter Phys. 2007 Oct;76(4 Pt 2):046610. doi: 10.1103/PhysRevE.76.046610. Epub 2007 Oct 25. Phys Rev E Stat Nonlin Soft Matter Phys. 2007. PMID: 17995130
-
Modeling of Electric Field and Dielectrophoretic Force in a Parallel-Plate Cell Separation Device with an Electrode Lid and Analytical Formulation Using Fourier Series.Sensors (Basel). 2024 Dec 31;25(1):185. doi: 10.3390/s25010185. Sensors (Basel). 2024. PMID: 39796975 Free PMC article.
-
Modeling of dielectrophoretic transport of myoglobin molecules in microchannels.Biomicrofluidics. 2010 Mar 1;4(1):14105. doi: 10.1063/1.3339773. Biomicrofluidics. 2010. PMID: 20644674 Free PMC article.
-
Electric field-induced effects on neuronal cell biology accompanying dielectrophoretic trapping.Adv Anat Embryol Cell Biol. 2003;173:III-IX, 1-77. doi: 10.1007/978-3-642-55469-8. Adv Anat Embryol Cell Biol. 2003. PMID: 12901336 Review.
-
Dielectrophoretic separation of bioparticles in microdevices: a review.Electrophoresis. 2014 Mar;35(5):691-713. doi: 10.1002/elps.201300424. Epub 2014 Feb 4. Electrophoresis. 2014. PMID: 24338825 Review.
References
-
- Pohl H.A. The motion and precipitation of suspensoids in divergent electric fields. J. Appl. Phys. 1951;22:869–871. doi: 10.1063/1.1700065. - DOI
-
- Pohl H.A. Some effects of nonuniform fields on dielectrics. J. Appl. Phys. 1958;29:1182–1188. doi: 10.1063/1.1723398. - DOI
-
- Washizu M., Jones T. Multipolar dielectrophoretic force calculation. J. Electrost. 1994;33:187–198. doi: 10.1016/0304-3886(94)90053-1. - DOI
-
- Wang X.-B., Huang Y., Becker F., Gascoyne P. A unified theory of dielectrophoresis and travelling wave dielectrophoresis. J. Phys. D Appl. Phys. 1994;27:1571. doi: 10.1088/0022-3727/27/7/036. - DOI
-
- Taniguchi K., Yamamoto H., Nakano Y., Sakai T., Morikuni S., Watanabe S. A New Technique for Measuring the Distribution of Charge-to-Mass Ration for Toner Particles with On-Line Use. J. Imaging Sci. Technol. 2003;47:224–228. doi: 10.2352/J.ImagingSci.Technol.2003.47.3.art00004. - DOI
LinkOut - more resources
Full Text Sources
