. 2023 Jun 27;11(7):1668.
doi: 10.3390/microorganisms11071668.

Metagenomic Analyses Reveal the Influence of Depth Layers on Marine Biodiversity on Tropical and Subtropical Regions

Affiliations

Metagenomic Analyses Reveal the Influence of Depth Layers on Marine Biodiversity on Tropical and Subtropical Regions

Bianca C F Santiago et al. Microorganisms. .

Abstract

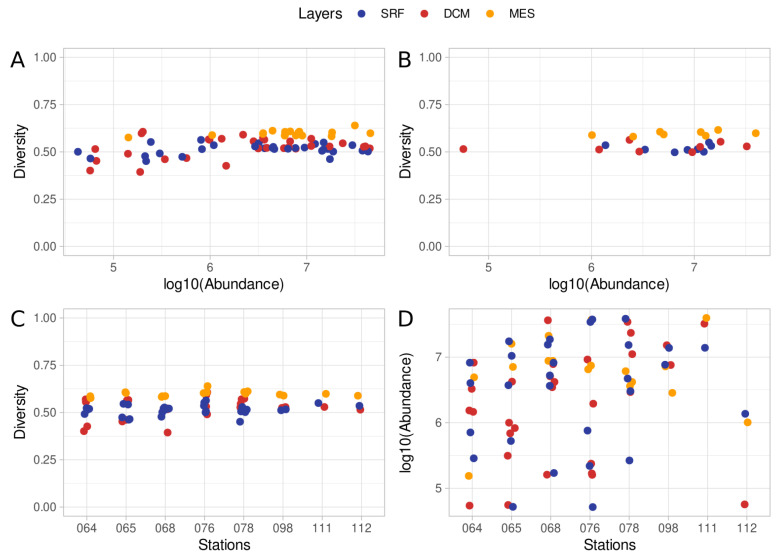
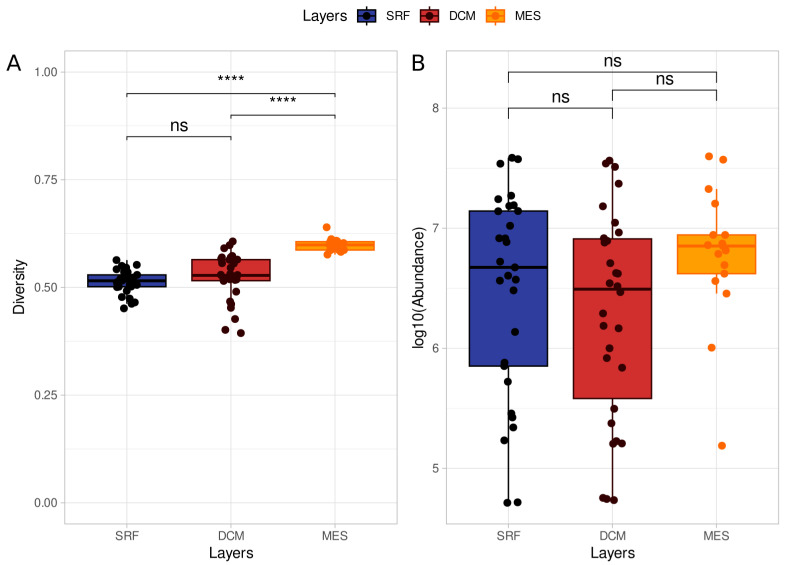
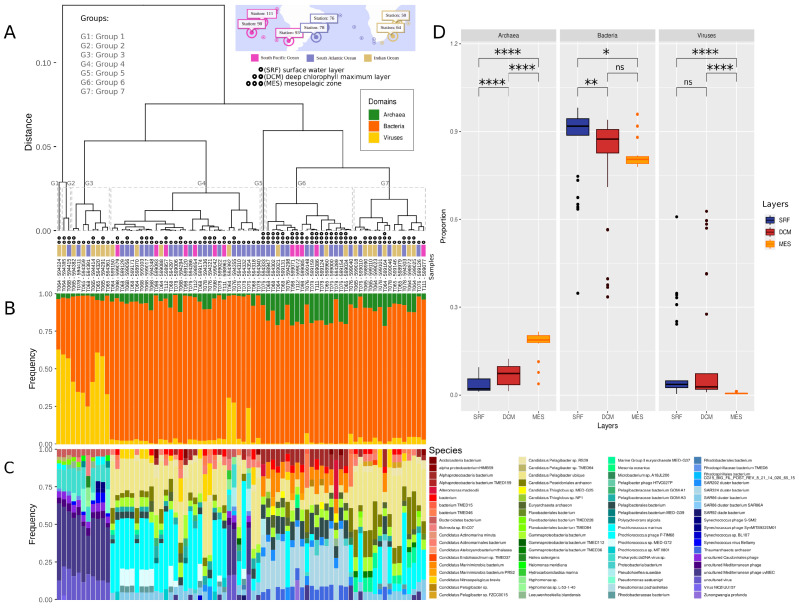
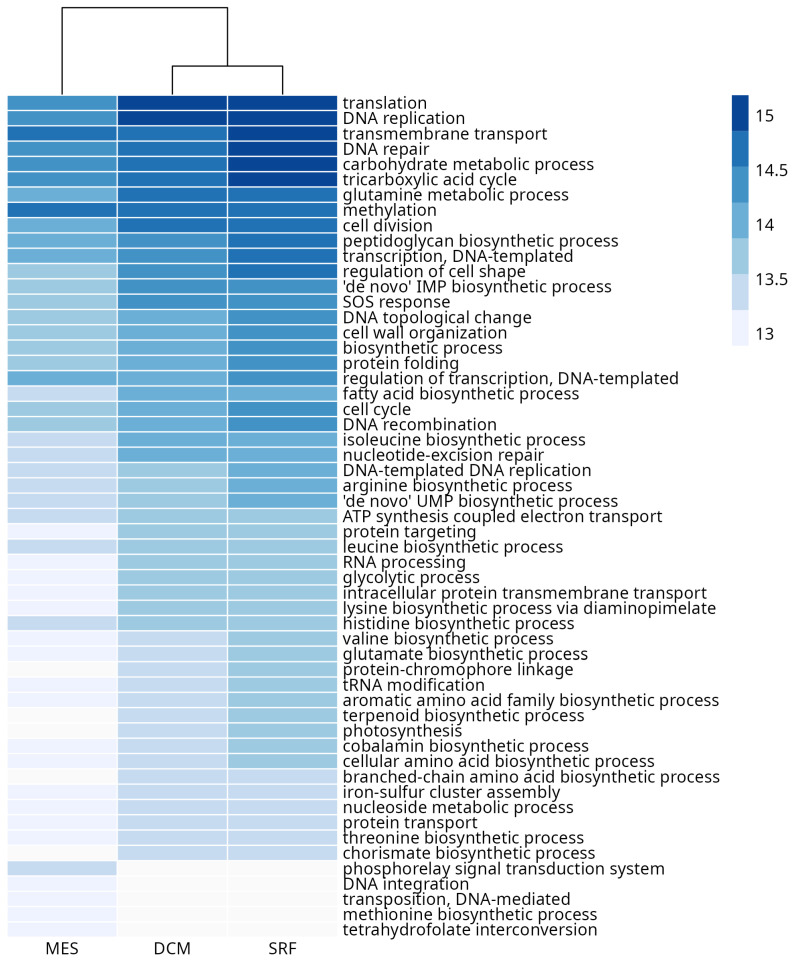
The emergence of open ocean global-scale studies provided important information about the genomics of oceanic microbial communities. Metagenomic analyses shed light on the structure of marine habitats, unraveling the biodiversity of different water masses. Many biological and environmental factors can contribute to marine organism composition, such as depth. However, much remains unknown about microbial communities' taxonomic and functional features in different water layer depths. Here, we performed a metagenomic analysis of 76 publicly available samples from the Tara Ocean Project, distributed in 8 collection stations located in tropical or subtropical regions, and sampled from three layers of depth (surface water layer-SRF, deep chlorophyll maximum layer-DCM, and mesopelagic zone-MES). The SRF and DCM depth layers are similar in abundance and diversity, while the MES layer presents greater diversity than the other layers. Diversity clustering analysis shows differences regarding the taxonomic content of samples. At the domain level, bacteria prevail in most samples, and the MES layer presents the highest proportion of archaea among all samples. Taken together, our results indicate that the depth layer influences microbial sample composition and diversity.

Keywords: depth layers; marine biodiversity; metagenome analysis; pelagic zones.


Conflict of interest statement

The authors declare that the research was conducted in the absence of any commercial or financial relationships that could be construed as a potential conflict of interest.

Figures

Figure 1
Figure 1
Distribution of diversity and abundance indices. (A) Comparison of diversity and log10-scaled abundance indexes by sample. (B) Diversity and log10-scaled abundance averages by the station. (C) Diversity distribution by the station. (D) Log10-scaled abundance distribution by the station. The abundance index is the number of reads attributed to a given taxon in a given sample. The diversity was estimated by the normalized Shannon-Wiener Index (SWI, see Section 2 (Materials and Methods) for details).
Figure 2
Figure 2
Diversity and abundance distribution by layer. (A) Diversity comparison between layers shows increasing diversity with increasing depth. (B) Abundance comparison between layers shows no significant association with depth layers. Comparisons were performed with the Wilcoxon rank sum test and Bonferroni-adjusted p-values were represented in each comparison. Significant comparisons are the ones with adjusted p-values < 0.05. Statistical significance is represented as follows. ns (adjusted p-value > 0.05); **** (adjusted p-value ≤ 0.0001). The abundance index is the number of reads attributed to a given taxon in a given sample. The diversity was estimated by the normalized Shannon-Wiener Index (SWI, see Section 2 (Materials and Methods) for details).
Figure 3
Figure 3
Clustering analysis of samples by diversity. (A) Dendrogram of samples clustered by the diversity index. Seven groups of samples were identified and named from G1 to G7. Samples are also represented by depth layers and oceans. The sample names are a combination of the station and the accession number. (e.g., the T064-594324 sample belongs to the station 064, and the ENA accession number is ERR594324). (B) The domain-level taxonomic classification shows the proportion of each domain (archaea, bacteria, and viruses) in each sample. (C) The species-level taxonomic classification shows the proportion of each species (the ten most frequent) in each sample. (D) Distribution of domain proportions considering the samples of each depth layer. Statistical significance is represented as follows. ns (adjusted p-value > 0.05); * (adjusted p-value ≤ 0.05); ** (adjusted p-value ≤ 0.01); **** (adjusted p-value ≤ 0.0001).
Figure 4
Figure 4
Frequency (log10-transformed) in each layer of the 50 overall most common functional terms. Frequency is defined as the total number of term occurrences in each layer (see Section 2 (Materials and Methods) for details).

References

    1. Sala E., Mayorga J., Bradley D., Cabral R.B., Atwood T.B., Auber A., Cheung W., Costello C., Ferretti F., Friedlander A.M., et al. Protecting the global ocean for biodiversity, food and climate. Nature. 2021;592:397–402. doi: 10.1038/s41586-021-03371-z. - DOI - PubMed
    1. Grosberg R.K., Vermeij G.J., Wainwright P.C. Biodiversity in water and on land. Curr. Biol. 2012;22:R900–R903. doi: 10.1016/j.cub.2012.09.050. - DOI - PubMed
    1. Costello M.J., Chaudhary C. Marine Biodiversity, Biogeography, Deep-Sea Gradients, and Conservation. Curr. Biol. 2017;27:R511–R527. doi: 10.1016/j.cub.2017.04.060. - DOI - PubMed
    1. Costello M.J., Wilson S., Houlding B. Predicting Total Global Species Richness Using Rates of Species Description and Estimates of Taxonomic Effort. Syst. Biol. 2012;61:871. doi: 10.1093/sysbio/syr080. - DOI - PubMed
    1. Aguzzi J., Chatzievangelou D., Marini S., Fanelli E., Danovaro R., Flögel S., Lebris N., Juanes F., De Leo F.C., Del Rio J., et al. New High-Tech Flexible Networks for the Monitoring of Deep-Sea Ecosystems. Environ. Sci. Technol. 2019;53:6616–6631. doi: 10.1021/acs.est.9b00409. - DOI - PubMed

LinkOut - more resources