. 2023 Jul 20;28(14):5527.
doi: 10.3390/molecules28145527.

Artemisinin Confers Neuroprotection against 6-OHDA-Induced Neuronal Injury In Vitro and In Vivo through Activation of the ERK1/2 Pathway

Affiliations

Artemisinin Confers Neuroprotection against 6-OHDA-Induced Neuronal Injury In Vitro and In Vivo through Activation of the ERK1/2 Pathway

Qin Li et al. Molecules. .

Abstract

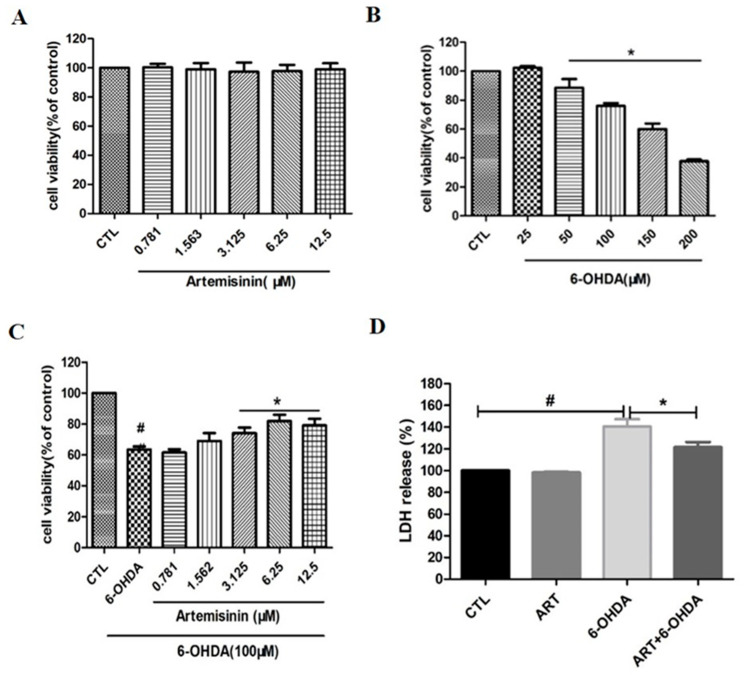
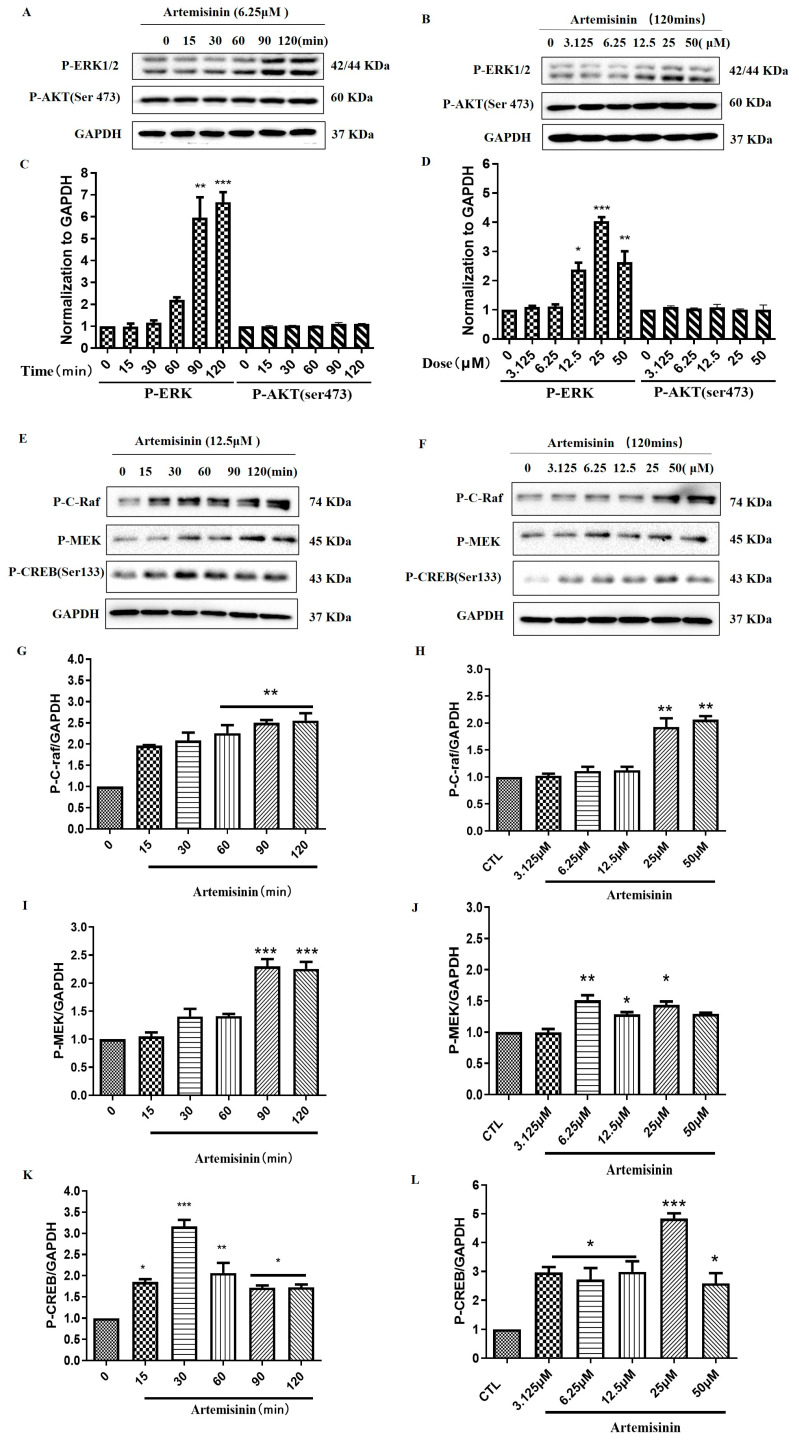
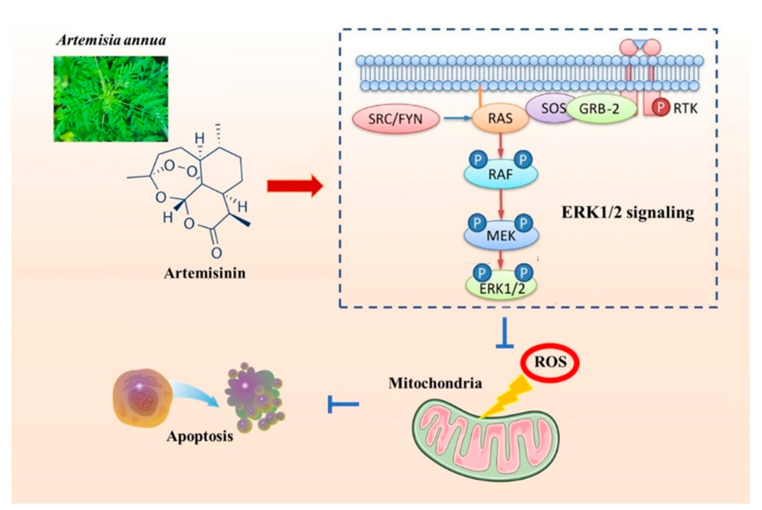
Parkinson's disease (PD) is an age-related, progressive neurodegenerative disease characterized by the gradual and massive loss of dopaminergic neurons in the substantia nigra pars compacta (SNc). We have recently reported that artemisinin, an FDA-approved first-line antimalarial drug, possesses a neuroprotective effect. However, the effects and underlying mechanisms of artemisinin on Parkinson's disease remain to be elucidated. In this study, we investigated the neuroprotective effects of artemisinin on 6-OHDA and MPP+ in neuronal cells and animal models, as well as the underlying mechanisms. Our results showed that artemisinin significantly attenuated the loss of cell viability, LDH release, elevated levels of reactive oxygen species (ROS), the collapse of the mitochondria trans-membrane potential and cell apoptosis in PC12 cells. Western blot results showed that artemisinin stimulated the phosphorylation of ERK1/2, its upstream signaling proteins c-Raf and MEK and its downstream target CREB in PC12 cells in a time- and concentration-dependent manner. In addition, the protective effect of artemisinin was significantly reduced when the ERK pathway was blocked using the ERK pathway inhibitor PD98059 or when the expression of ERK was knocked down using sgRNA. These results indicate the essential role of ERK in the protective effect of artemisinin. Similar results were obtained in SH-SY5Y cells and primary cultured neurons treated with 6-OHDA, as well as in cellular models of MPP+ injury. More interestingly, artemisinin attenuated PD-like behavior deficit in mice injected with 6-OHDA evaluated by behavioral tests including swimming test, pole-test, open field exploration and rotarod tests. Moreover, artemisinin also stimulated the phosphorylation of ERK1/2, inhibited apoptosis, and rescued dopaminergic neurons in SNc of these animals. Application of ERK pathway inhibitor PD98059 blocked the protective effect of artemisinin in mice during testing. Taking these results together, it was indicated that artemisinin preserves neuroprotective effects against 6-OHDA and MPP+ induced injury both in vitro and in vivo by the stimulation of the ERK1/2 signaling pathway. Our findings support the potential therapeutic effect of artemisinin in the prevention and treatment of Parkinson's disease.

Keywords: 6-OHDA; MPTP/MPP+; Parkinson’s disease; apoptosis; artemisinin.


Conflict of interest statement

The authors declare no conflict of interest.

Figures

Figure 1
Figure 1
Artemisinin attenuated the decrease in cell viability caused by 6-OHDA in PC12 cells. (A) The cytotoxicity of artemisinin. Cells were treated with different concentrations of artemisinin for 24 h and the cell viability was measured by MTT assay. (B) The cytotoxicity of 6-OHDA. Cells were treated with different concentrations of 6-OHDA for 24 h. The cell viability was measured by MTT assay. (C,D) Cells were pretreated with artemisinin at different concentrations for 2 h and then incubated with or without 100 μM 6-OHDA for a further 24 h. The cell viability and cell cytotoxicity were measured by MTT (C) and LDH (D) assays. Data representing mean ± SD, * p < 0.05, # p < 0.05 were considered significantly different.
Figure 2
Figure 2
Artemisinin inhibited 6-OHDA-induced elevated ROS levels and 6-OHDA and MPP+-induced mitochondrial membrane potential loss in PC12 cells. Cells were pretreated with 6.25 μM Artemisinin and then incubated with or without 100 μM 6-OHDA for further 24 h. (A) The intracellular ROS was measured by DCFH-DA reagent. Micrographs of fluorescent labeled cells stained by DCFH-DA reagent for ROS (scale bars, 200 μm). (B) Quantitative analysis of A. Cells were pretreated with 6.25 μM Artemisinin and then incubated with or without 100 μM 6-OHDA or 1000 μM MPP+ for further 24 h. (C,D) The decline of the mitochondrial membrane potential was reflected by the shift of fluorescence from red to green indicated by JC-1 (scale bars, 100 μm). (E,F) Quantitative analysis of (C,D). Data represent mean ± SD, * p < 0.05, # p < 0.05 were considered significantly different.
Figure 3
Figure 3
Artemisinin suppressed 6-OHDA and MPP+-induced apoptosis in PC12 cells. Cells were pre-treated with 6.25 μM artemisinin for 2 h and then induced with or without 100 μM 6-OHDA or 1000 μM MPP+ for another 24 h (A,B) Photographs of the representative cultures measured by flow cytometry. (C,D) Quantitative analysis of A and B. Data represent mean ± SD, * p < 0.05, # p < 0.05 were considered significantly different.
Figure 4
Figure 4
Artemisinin stimulated the phosphorylation/activation of ERK1/2, and C-Raf, MEK and CREB at a concentration- and time-dependent manner in PC12 cells. (A,B) The PC12 cells were collected with artemisinin treatment for different times (0, 15, 30, 60, 90 and 120 min) at 6.25 μM, and at different concentrations (3.125, 6.25, 12.5, 25 and 50 μM) for 120 min. The phosphorylation of ERK1/2, AKT and expression of GAPDH were detected by western blot. (C,D) Quantitative analysis of A and B. (E,F) The PC12 cells were collected with artemisinin treatment for different times (0, 15, 30, 60, 90 and 120 min) at 12.5 μM, and at different concentrations (3.125, 6.25, 12.5, 25 and 50 μM) for 120 min. The expression of P-C-Raf, P-MEK, P-CREB and GAPDH were detected by western blot. (GL) Quantitative analysis of (G,H). Data represent mean ± SEM, * p < 0.05, ** p < 0.01, *** p < 0.001 were considered significantly different.
Figure 5
Figure 5
ERK1/2 specific inhibitor blocked the protective effect of artemisinin in PC12 cells. (A) Cells were pre-treated with 50 µM PD98059 (ERK inhibitor) for 60 min, treated with 6.25 µM artemisinin for 2 h and then incubated with or without 100 µM 6-OHDA for another 24 h. The cell viability was determined by MTT assay. (B) Cells were transfected with ERK1/2 sgRNA, pre-treated with 6.25 μM artemisinin for 2 h and then incubated with or without 100 μM 6-OHDA for another 24 h. Cell viability was measured by MTT assay. (C) Effect of PD98059 on artemisinin protective action against 6-OHDA-induced increase of intracellular ROS levels. Micrographs of fluorescent labeled cells stained by DCFH-DA reagent for ROS (scale bars, 100 μm). (D) Quantification of (C). (E) Effect of PD98059 on artemisinin protective action against 6-OHDA-induced decline of the mitochondrial membrane potential. The decline of the mitochondrial membrane potential was reflected by the shift of fluorescence from red to green indicated by JC-1 (scale bars, 100 μm). (F) Quantification of (E). Data represent mean ± SD, * p < 0.05, ** p < 0.01, *** p < 0.001, & p < 0.05, # p < 0.05 were considered significantly different.
Figure 6
Figure 6
ERK1/2 specific inhibitor blocked the anti-apoptotic effect of artemisinin in PC12 cells. (A) Hoechst staining was used to evaluate the effect of PD98059 on artemisinin action against 6-OHDA-induced cell apoptosis. Micrographs of fluorescent labeled cells by Hoechst staining (scale bars, 200 μm). (B) Quantification of (A). (C) Photographs of representative cultures measured by flow cytometry. (D) Quantification of (C). (E) The expression of Bcl2, Bax and GAPDH were detected by western blot. (F) Quantification of Bcl2/Bax ratio. Data represent mean ± SD, * p < 0.05, *** p < 0.001, & p < 0.05, # p < 0.05 were considered significantly different.
Figure 7
Figure 7
Artemisinin attenuated the decrease in cell viability caused by 6-OHDA and MPP+ in SH-SY5Y cells and primary cultured neurons. (A) The cytotoxicity of 6-OHDA in SH-SY5Y cells. Cells were treated with different concentrations of 6-OHDA for 24 h and cell viability was measured using the MTT assay. (B) Cells were pre-treated with 25 µM PD98059 (ERK inhibitor) for 40 min, treated with 6.25 µM artemisinin for 2 h and then incubated with or without 6-OHDA for another 24 h. The cells viability was determined by MTT assay. (C) The cytotoxicity of MPP+ in SH-SY5Y cells. Cells were treated with different concentrations of MPP+ for 24 h and cell viability was measured using the MTT assay. (D) Cells were pre-treated with 25 µM PD98059 (ERK inhibitor) for 40 min, treated with 6.25 µM artemisinin for 2 h and then incubated with or without MPP+ for another 24 h. The cells viability was determined by MTT assay. (E) The cytotoxicity of 6-OHDA in primary cultured neurons. Cells were treated with different concentrations of 6-OHDA for 24 h and cell viability was measured using the MTT assay. (F) Primary cultured neurons were pre-treated with 20 µM PD98059 (ERK inhibitor) for 40 min, treated with 6.25 µM artemisinin for 2 h and then incubated with or without 6-OHDA for another 24 h. The cells viability was determined by MTT assay. (G) The cytotoxicity of MPP+ in primary cultured neurons. Cells were treated with different concentrations of MPP+ for 24 h and cell viability was measured using the MTT assay. (H) Cells were pre-treated with 20 µM PD98059 (ERK inhibitor) for 40 min, treated with 6.25 µM artemisinin for 2 h and then incubated with or without MPP+ for another 24 h. The cells viability was measured using the MTT assay. Data represent means ± SD, * p < 0.05, ** p < 0.01, *** p < 0.001, & p < 0.05, # p < 0.05 were considered significantly different.
Figure 8
Figure 8
Artemisinin attenuated the behavioral deficits of 6-OHDA-induced PD mice model observed in open field and pole tests. (AC) Representative pictures of the open field exploration test in each group. (D) The distance traveled in the open field exploration test. (E) Number of central entries in the open field exploration test. (F) The climbing time of each group in the pole-test. Data represent means ± SD, * p < 0.05 were considered significantly different.
Figure 9
Figure 9
Artemisinin attenuated the behavioral deficits in the MPTP-induced PD mice model observed in the open field and pole tests. (A) The climbing time of each group in pole-test; (B) Number of rearing in the open field exploration test; (C) Number of line crossings in the open field exploration test. Data represent means ± SD, * p < 0.05, ** p < 0.01 were considered significantly different.
Figure 10
Figure 10
Artemisinin treatment activated the phosphorylation of ERK1/2 in 6-OHDA-induced PD mice model and pretreatment with PD98059 reversed this effect. (A) The expression of p-ERK1/2 in substantia nigra was detected by immunofluorescence and analyzed by Image pro plus software. (B,C) Effect of ERK inhibitor PD98059 pre-treatment on artemisinin neuroprotective action on 6-OHDA-induced PD mice model. (B) The expression levels of p-ERK, p-CREB, Bax, Bcl2 and GAPDH were detected by western blotting. (CE) Quantification of the western blotting results. Data represent means ± SD, * p < 0.05, ** p < 0.01 were considered significantly different.
Figure 11
Figure 11
PD98059 pretreatment reversed the effect of artemisinin in the behavioral deficits. (A) Representative pictures of the swimming test in each group. (B) The distance traveled for 1 min of each group in the swimming test. (C) The average speed of each group in the swimming test. (D) The climbing time of each group in the pole-test. (E) The number of central entries of each group in the open field exploration test. (F) The distance traveled of each group in the open field exploration test. (G) The drop speed of each group in the rotarod test. (H) The time stayed on rod of each group in the in the rotarod test; (I) The total distance of each group in the rotarod test. Data represent means ± SD, * p < 0.05 were considered significantly different.
Figure 12
Figure 12
Artemisinin attenuated the pathological damage in 6-OHDA-induced PD mice model and these effects can be reversed by PD98059 treatment. (A) Representative images of H&E staining in substantia nigra of brain. Scale bars 200 μm (B) Representative images of Nissl staining in substantia nigra of brain, Scale bars 100 μm. (C) Representative images of TH immunofluorescence in substantia nigra of brain. (D) Representative images of GFAP immunofluorescence in substantia nigra of brain. Scale bars 200 μm. (E) Quantification of Nissl staining; (F) Quantification of TH immunofluorescence; (G) Quantification of GFAP immunofluorescence. Data represent means ± SD, * p < 0.05, ** p < 0.01 *** p < 0.001 were considered significantly different.
Figure 13
Figure 13
Putative mechanism of artemisinin neuroprotective action against 6-OHDA and MPP+-induced neuronal injury. Artemisinin stimulated ERK1/2 related signaling pathway in neuronal cells and the brain of the PD mice model, resulting in the reduction of oxidative stress, correction of mitochondrial dysfunction, and inhibition of apoptosis.

References

    1. Martinez B.A., Petersen D.A., Gaeta A.L., Stanley S.P. Dysregulation of the Mitochondrial Unfolded Protein Response Induces Non-Apoptotic Dopaminergic Neurodegeneration in C. elegans Models of Parkinson’s Disease. J. Neurosci. 2017;37:11085–11100. - PMC - PubMed
    1. Pang S.Y., Ho P.W., Liu H.F., Leung C.T., Li L., Chang E.E.S., Ramsden D.B., Ho S.L. The Interplay of Aging, Genetics and Environmental Factors in the Pathogenesis of Parkinson’s Disease. Transl. Neurodegener. 2019;8:23. doi: 10.1186/s40035-019-0165-9. - DOI - PMC - PubMed
    1. Morris G., Berk M. The Many Roads to Mitochondrial Dysfunction in Neuroimmune and Neuropsychiatric Disorders. BMC Med. 2015;13:68. doi: 10.1186/s12916-015-0310-y. - DOI - PMC - PubMed
    1. Hu D., Sun X., Liao X., Zhang X., Zarabi S., Schimmer A., Hong Y., Ford C., Luo Y., Qi X. Alpha-Synuclein Suppresses Mitochondrial Protease Clpp to Trigger Mitochondrial Oxidative Damage and Neurotoxicity. Acta Neuropathol. 2019;137:939–960. doi: 10.1007/s00401-019-01993-2. - DOI - PMC - PubMed
    1. Ding Y., Xin C., Zhang C.W., Lim K.L., Zhang H., Fu Z., Li L., Huang W. Natural Molecules from Chinese Herbs Protecting against Parkinson’s Disease via Anti-Oxidative Stress. Front. Aging Neurosci. 2018;10:246. doi: 10.3389/fnagi.2018.00246. - DOI - PMC - PubMed