. 2023 Jul 24;15(14):3284.
doi: 10.3390/nu15143284.

Human Breast Milk microRNAs, Potential Players in the Regulation of Nervous System

Affiliations

Human Breast Milk microRNAs, Potential Players in the Regulation of Nervous System

Luis Freiría-Martínez et al. Nutrients. .

Abstract

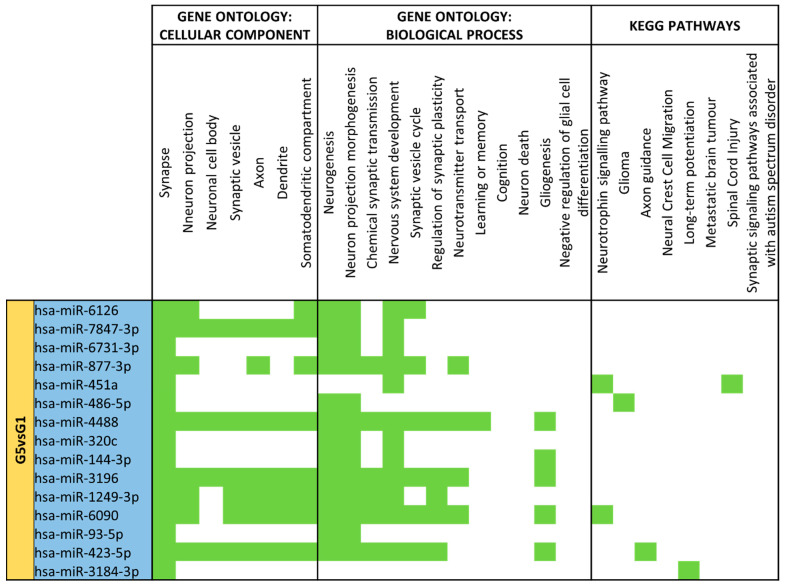
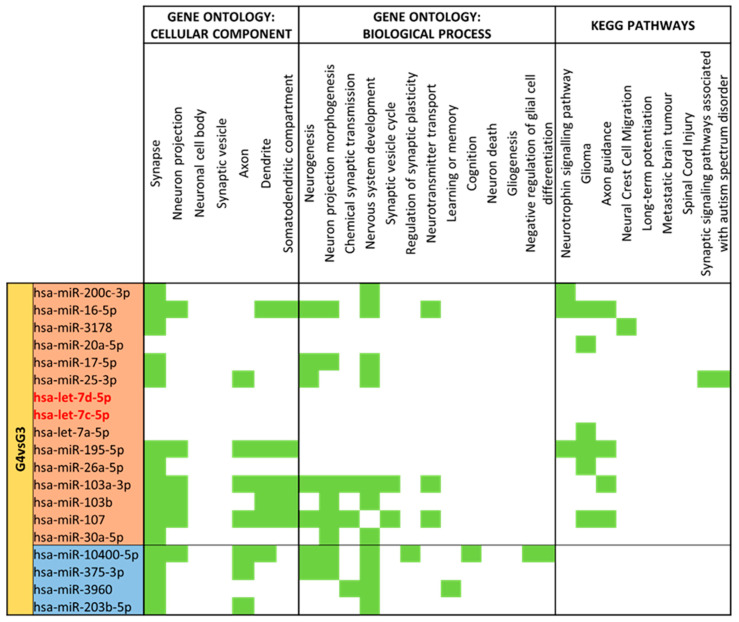
Human milk is the biological fluid with the highest exosome amount and is rich in microRNAs (miRNAs). These are key regulators of gene expression networks in both normal physiologic and disease contexts, miRNAs can influence many biological processes and have also shown promise as biomarkers for disease. One of the key aspects in the regeneration of the nervous system is that there are practically no molecules that can be used as potential drugs. In the first weeks of lactation, we know that human breast milk must contain the mechanisms to transmit molecular and biological information for brain development. For this reason, our objective is to identify new modulators of the nervous system that can be used to investigate neurodevelopmental functions based on miRNAs. To do this, we collected human breast milk samples according to the time of delivery and milk states: mature milk and colostrum at term; moderate and very preterm mature milk and colostrum; and late preterm mature milk. We extracted exosomes and miRNAs and realized the miRNA functional assays and target prediction. Our results demonstrate that miRNAs are abundant in human milk and likely play significant roles in neurodevelopment and normal function. We found 132 different miRNAs were identified across all samples. Sixty-nine miRNAs had significant differential expression after paired group comparison. These miRNAs are implicated in gene regulation of dopaminergic/glutamatergic synapses and neurotransmitter secretion and are related to the biological process that regulates neuron projection morphogenesis and synaptic vesicle transport. We observed differences according to the delivery time and with less clarity according to the milk type. Our data demonstrate that miRNAs are abundant in human milk and likely play significant roles in neurodevelopment and normal function.

Keywords: colostrum; exosome; human milk; miRNAs; nervous system; neurodevelopment; small RNA sequencing.


Conflict of interest statement

The authors declare no conflict of interest.

Figures

Figure 1
Figure 1
Western blot for exosome-specific surface markers CD9, CD63 and CD81 across exosome-containing fractions extracted with EX04 Exo-spinTM midi column.
Figure 2
Figure 2
TEM microscopy images of isolated exosomes stained with Phosphotungstic Acid.
Figure 3
Figure 3
Electropherogram for samples G1 (Term Mature Milk), G2 (Term Colostrum), G3 (Moderate/very Preterm Mature Milk), G4 (Moderate/very Preterm Colostrum) and G5 (Late Preterm Milk) Eukaryote Total RNA Nano Assay.
Figure 4
Figure 4
Electropherogram for samples G1 (Term Mature Milk), G2 (Term Colostrum), G3 (Moderate/very Preterm Mature Milk), G4 (Moderate/very Preterm Colostrum) and G5 (Late Preterm Milk) Small RNA Assay.
Figure 5
Figure 5
Volcano plot depicting the significant differentially expressed miRNAs from Term Colostrum (G2) vs. Term Mature Milk (G1). miRNAs with red dots are upregulated, miRNAs with blue dots are downregulated in G2 vs. G1.
Figure 6
Figure 6
Volcano plot depicting the significant differentially expressed miRNAs from Moderate/Very Preterm Mature Milk (G3) vs. Term Mature Milk (G1). miRNAs with red dots are upregulated, miRNAs with blue dots are downregulated in G3 vs. G1.
Figure 7
Figure 7
Volcano plot depicting the significant differentially expressed miRNAs from Late Preterm Mature Milk (G5) vs. Term Mature Milk (G1). miRNAs with blue dots are downregulated in G5 vs. G1.
Figure 8
Figure 8
Volcano plot depicting the significant differentially expressed miRNAs from Moderate/Very Preterm Colostrum (G4) vs. Term Colostrum (G2). miRNAs with red dots are upregulated, miRNAs with blue dots are downregulated in G4 vs. G2.
Figure 9
Figure 9
Volcano plot depicting the significant differentially expressed miRNAs from Moderate/Very Preterm Colostrum (G4) vs. Moderate/Very Preterm Mature Milk (G3). miRNAs with red dots are upregulated, miRNAs with blue dots are downregulated in G4 vs. G3.
Figure 10
Figure 10
Volcano plot depicting the significant differentially expressed miRNAs from Late Preterm Mature Milk (G5) vs. Moderate/Very Preterm Mature Milk (G3). miRNAs with red dots are upregulated, miRNAs with blue dots are downregulated in G5 vs. G3.
Figure 11
Figure 11
PCA plot for samples in (A) Term Mature Milk (G1) and Colostrum (G2) groups. (B) Term (G1) and Moderate/Very Preterm (G3) Mature Milk groups. (C) Term (G1) and Late Preterm (G5) Mature Milk groups. (D) Term (G2) and Moderate/Very Preterm (G4) Colostrum groups. (E) Moderate/Very Preterm Mature Milk (G3) and Colostrum (G4) groups. (F) Moderate/Very Preterm (G3) and Late Preterm (G5) Mature Milk groups.
Figure 12
Figure 12
miRNA target analysis in terms of Cellular Component, Biological Process and KEGG Pathways for significant differentially expressed miRNAs for Term Colostrum (G2) vs. Mature Milk (G1). miRNAs with red backgrounds are upregulated, whereas miRNAs with blue backgrounds are downregulated in G2 compared to G1. In green it is represented when the miRNA localizes within the pathways in terms of Cellular Component, Biological Process and KEGG.
Figure 13
Figure 13
miRNA target analysis in terms of Cellular Component, Biological Process and KEGG Pathways for significant differentially expressed miRNAs for Moderate/Very Preterm (G3) vs. Term (G1) Mature Milk. miRNAs with a red background are upregulated, whereas miRNAs with a blue background are downregulated in G3 compared to G1. In green it is represented when the miRNA localizes within the pathways in terms of Cellular Component, Biological Process and KEGG.
Figure 14
Figure 14
miRNA target analysis in terms of Cellular Component, Biological Process and KEGG Pathways for significant differentially expressed miRNAs for Late Preterm (G5) vs. Term (G1) Mature Milk. miRNAs with a blue background are downregulated in G5 compared to G1. In green it is represented when the miRNA localizes within the pathways in terms of Cellular Component, Biological Process and KEGG.
Figure 15
Figure 15
miRNA target analysis in terms of Cellular Component, Biological Process and KEGG Pathways for significant differentially expressed miRNAs for Moderate/Very Preterm (G4) vs. Term (G2) Colostrum. miRNAs with red backgrounds are upregulated, whereas miRNAs with blue backgrounds are downregulated in G4 compared to G2. In green it is represented when the miRNA localizes within the pathways in terms of Cellular Component, Biological Process and KEGG.
Figure 16
Figure 16
miRNA target analysis in terms of Cellular Component, Biological Process and KEGG Pathways for significant differentially expressed miRNAs for Moderate/Very Preterm Colostrum (G4) vs. Mature Milk (G3). miRNAs with a red background are upregulated, whereas miRNAs with a blue background are downregulated in G4 compared to G3. In green it is represented when the miRNA localizes within the pathways in terms of Cellular Component, Biological Process and KEGG.
Figure 17
Figure 17
miRNA target analysis in terms of Cellular Component, Biological Process and KEGG Pathways for significant differentially expressed miRNAs for Late Preterm (G5) vs. Moderate/Very Preterm (G3) Mature Milk. miRNAs with a red background are upregulated, whereas miRNAs with a blue background are downregulated in G5 compared to G3. In green it is represented when the miRNA localizes within the pathways in terms of Cellular Component, Biological Process and KEGG.
Figure 18
Figure 18
miRNA target analysis over codifying genes of 9 neuro-related proteins for the significant differentially expressed miRNAs in Term Colostrum (G2) vs. Mature Milk (G1). miRNAs in the red background are upregulated, and miRNAs in the blue background are downregulated. Green cells mean the relationship between genes and miRNA.
Figure 19
Figure 19
miRNA target analysis over codifying genes of 9 neuro-related proteins for the significant differentially expressed miRNAs in Moderate/Very Preterm (G3) vs. Term (G1) Mature Milk. miRNAs with red background are upregulated, miRNAs with blue background are downregulated. Green cells mean the relationship between genes and miRNA. Green cells mean the relationship between genes and miRNA.
Figure 20
Figure 20
miRNA target analysis over codifying genes of 9 neuro-related proteins for the significant differentially expressed miRNAs in Late Preterm (G5) vs. Term (G1) Mature Milk. miRNAs with a blue background are downregulated. Green cells mean the relationship between genes and miRNA.
Figure 21
Figure 21
miRNA target analysis over codifying genes of 9 neuro-related proteins for the significant differentially expressed miRNAs in Moderate/Very Preterm (G4) vs. Term (G2) Colostrum. miRNAs with red background are upregulated, miRNAs with blue background are downregulated. Green cells mean the relationship between genes and miRNA.
Figure 22
Figure 22
miRNA target analysis over codifying genes of 9 neuro-related proteins for the significant differentially expressed miRNAs in Moderate/Very Preterm Colostrum (G4) vs. Mature Milk (G3). miRNAs with red background are upregulated, miRNAs with blue background are downregulated. Green cells mean the relationship between genes and miRNA.
Figure 23
Figure 23
miRNA target analysis over codifying genes of 9 neuro-related proteins for the significant differentially expressed miRNAs in Late Preterm (G5) vs. Moderate/Very Preterm (G3) Mature Milk. miRNAs with red background are upregulated, miRNAs with blue background are downregulated. Green cells mean the relationship between genes and miRNA.
Figure 24
Figure 24
Balances model about miRNA expression changes.

References

    1. Bzikowska-Jura A., Sobieraj P., Szostak-Węgierek D., Wesołowska A. Impact of infant and maternal factors on energy and macronutrient composition of human milk. Nutrients. 2020;12:2591. doi: 10.3390/nu12092591. - DOI - PMC - PubMed
    1. Alsaweed M., Hartmann P.E., Geddes D.T., Kakulas F. Micrornas in breastmilk and the lactating breast: Potential immunoprotectors and developmental regulators for the infant and the mother. Int. J. Environ. Res. Public Health. 2015;12:13981–14020. doi: 10.3390/ijerph121113981. - DOI - PMC - PubMed
    1. Munch E.M., Harris R.A., Mohammad M., Benham A.L., Pejerrey S.M., Showalter L., Hu M., Shope C.D., Maningat P.D., Gunaratne P.H., et al. Transcriptome Profiling of microRNA by Next-Gen Deep Sequencing Reveals Known and Novel miRNA Species in the Lipid Fraction of Human Breast Milk. PLoS ONE. 2013;8:e50564. doi: 10.1371/journal.pone.0050564. - DOI - PMC - PubMed
    1. Weber J.A., Baxter D.H., Zhang S., Huang D.Y., Huang K.H., Lee M.J., Galas D.J., Wang K. The microRNA spectrum in 12 body fluids. Clin. Chem. 2010;56:1733–1741. doi: 10.1373/clinchem.2010.147405. - DOI - PMC - PubMed
    1. Admyre C., Johansson S.M., Qazi K.R., Filén J.-J., Lahesmaa R., Norman M., Neve E.P.A., Scheynius A., Gabrielsson S. Exosomes with Immune Modulatory Features Are Present in Human Breast Milk. J. Immunol. 2007;179:1969–1978. doi: 10.4049/jimmunol.179.3.1969. - DOI - PubMed

LinkOut - more resources