

Genome-Wide Identification and Expression Analysis of the PLATZ Transcription Factor in Tomato
- PMID: 37514247
- PMCID: PMC10384190
- DOI: 10.3390/plants12142632
Genome-Wide Identification and Expression Analysis of the PLATZ Transcription Factor in Tomato
Abstract
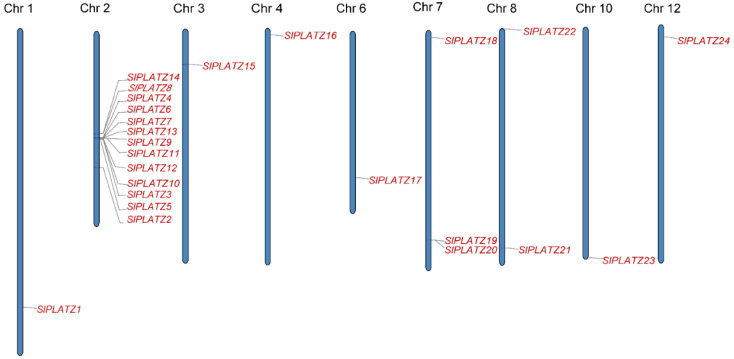
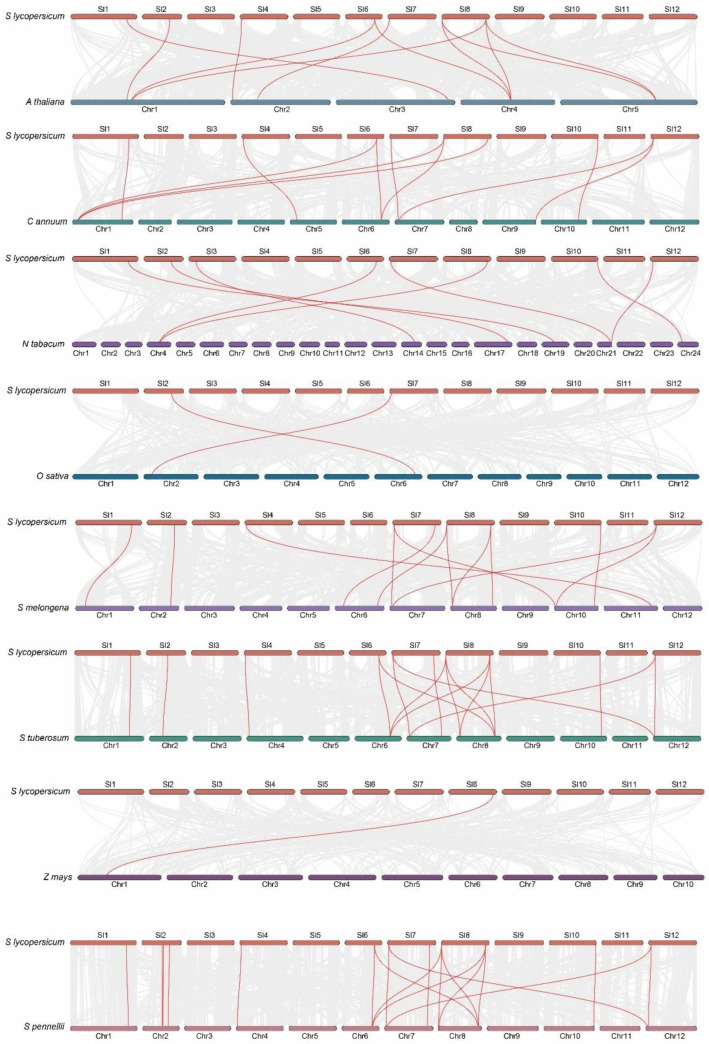
The PLATZ (plant AT protein and zinc-binding protein) transcription factor family is involved in the regulation of plant growth and development and plant stress response. In this study, 24 SlPLATZs were identified from the cultivated tomato genome and classified into four groups based on the similarity of conserved patterns among members of the same subfamily. Fragment duplication was an important way to expand the SlPLATZ gene family in tomatoes, and the sequential order of tomato PLATZ genes in the evolution of monocotyledonous and dicotyledonous plants and the roles they played were hypothesized. Expression profiles based on quantitative real-time reverse transcription PCR showed that SlPLATZ was involved in the growth of different tissues in tomatoes. SlPLATZ21 acts mainly in the leaves. SlPLATZ9, SlPLATZ21, and SlPLATZ23 were primarily involved in the red ripening, expanding, and mature green periods of fruit, respectively. In addition, SlPLATZ1 was found to play an important role in salt stress. This study will lay the foundation for the analysis of the biological functions of SlPLATZ genes and will also provide a theoretical basis for the selection and breeding of new tomato varieties and germplasm innovation.
Keywords: PLATZ gene family; biotic/abiotic stresses; expression analysis; phylogeny analysis.
Conflict of interest statement
The authors declare that they have no known competing financial interests or personal relationships that could have appeared to influence the work reported in this paper.
Figures


Similar articles
-
Exploring the Roles of the Plant AT-Rich Sequence and Zinc-Binding (PLATZ) Gene Family in Tomato (Solanum lycopersicum L.) Under Abiotic Stresses.Int J Mol Sci. 2025 Feb 16;26(4):1682. doi: 10.3390/ijms26041682. Int J Mol Sci. 2025. PMID: 40004146 Free PMC article.
-
Comprehensive Genome-Wide Analysis and Expression Pattern Profiling of PLATZ Gene Family Members in Solanum Lycopersicum L. under Multiple Abiotic Stresses.Plants (Basel). 2022 Nov 15;11(22):3112. doi: 10.3390/plants11223112. Plants (Basel). 2022. PMID: 36432841 Free PMC article.
-
Genome-Wide Identification and Phylogenetic and Expression Analyses of the PLATZ Gene Family in Medicago sativa L.Int J Mol Sci. 2023 Jan 25;24(3):2388. doi: 10.3390/ijms24032388. Int J Mol Sci. 2023. PMID: 36768707 Free PMC article.
-
The LEA gene family in tomato and its wild relatives: genome-wide identification, structural characterization, expression profiling, and role of SlLEA6 in drought stress.BMC Plant Biol. 2022 Dec 19;22(1):596. doi: 10.1186/s12870-022-03953-7. BMC Plant Biol. 2022. PMID: 36536303 Free PMC article.
-
Genome-Wide Identification of the WD40 Gene Family in Tomato (Solanum lycopersicum L.).Genes (Basel). 2023 Jun 15;14(6):1273. doi: 10.3390/genes14061273. Genes (Basel). 2023. PMID: 37372453 Free PMC article. Review.
Cited by
-
Genome-Wide Identification of CaPLATZ Family Members in Pepper and Their Expression Profiles in Response to Drought Stress.Genes (Basel). 2025 May 24;16(6):632. doi: 10.3390/genes16060632. Genes (Basel). 2025. PMID: 40565524 Free PMC article.
-
Transcriptome and Metabolome Reveal Key Genes from the Plant Hormone Signal Transduction Pathway Regulating Plant Height and Leaf Size in Capsicum baccatum.Cells. 2024 May 13;13(10):827. doi: 10.3390/cells13100827. Cells. 2024. PMID: 38786049 Free PMC article.
-
Exploring the Roles of the Plant AT-Rich Sequence and Zinc-Binding (PLATZ) Gene Family in Tomato (Solanum lycopersicum L.) Under Abiotic Stresses.Int J Mol Sci. 2025 Feb 16;26(4):1682. doi: 10.3390/ijms26041682. Int J Mol Sci. 2025. PMID: 40004146 Free PMC article.
-
Transcriptome analysis unveiled the genetic basis of rapid seed germination strategies in alpine plant Rheum pumilum.Sci Rep. 2024 Aug 19;14(1):19194. doi: 10.1038/s41598-024-70320-x. Sci Rep. 2024. PMID: 39160287 Free PMC article.
-
The Role of PLATZ6 in Raffinose Family Oligosaccharides Loading of Leaves via PLATZ Family Characterization in Cucumber.Plants (Basel). 2024 Oct 9;13(19):2825. doi: 10.3390/plants13192825. Plants (Basel). 2024. PMID: 39409694 Free PMC article.
References
Grants and funding
LinkOut - more resources
Full Text Sources
