. 2023 Jun 27;15(7):1454.
doi: 10.3390/v15071454.

Cytotoxic T Lymphocytes Control Growth of B16 Tumor Cells in Collagen-Fibrin Gels by Cytolytic and Non-Lytic Mechanisms

Affiliations

Cytotoxic T Lymphocytes Control Growth of B16 Tumor Cells in Collagen-Fibrin Gels by Cytolytic and Non-Lytic Mechanisms

Barun Majumder et al. Viruses. .

Abstract

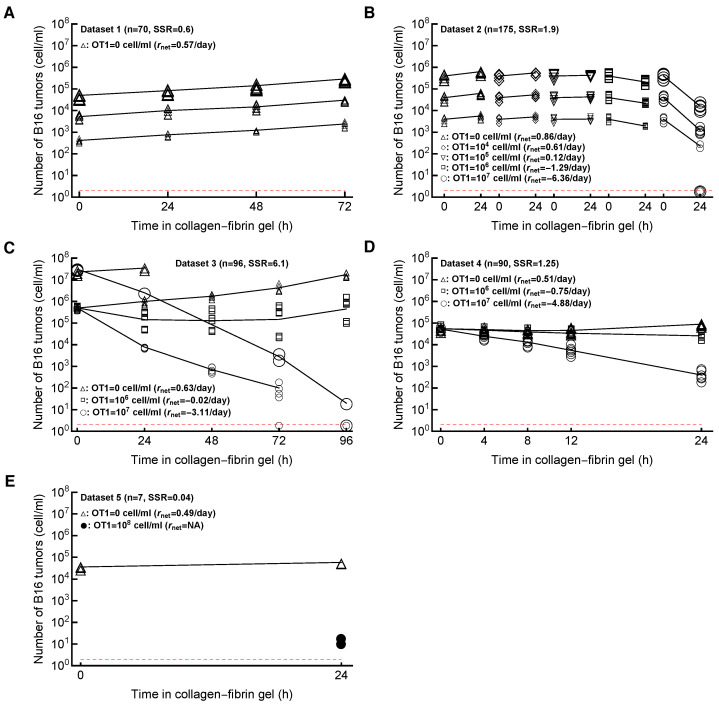
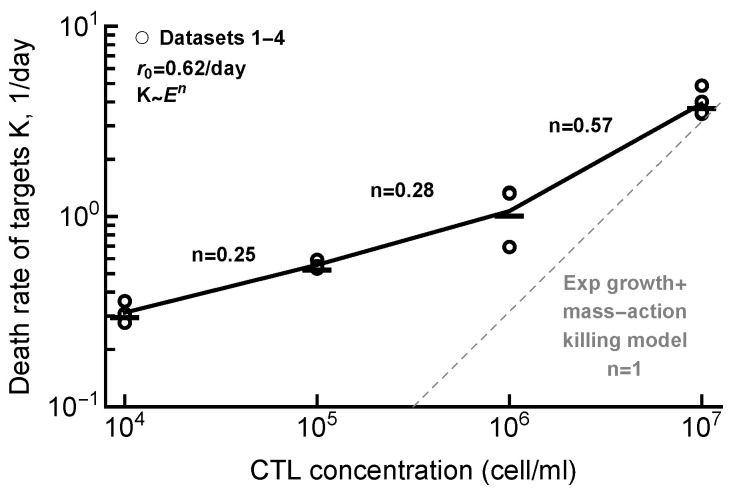
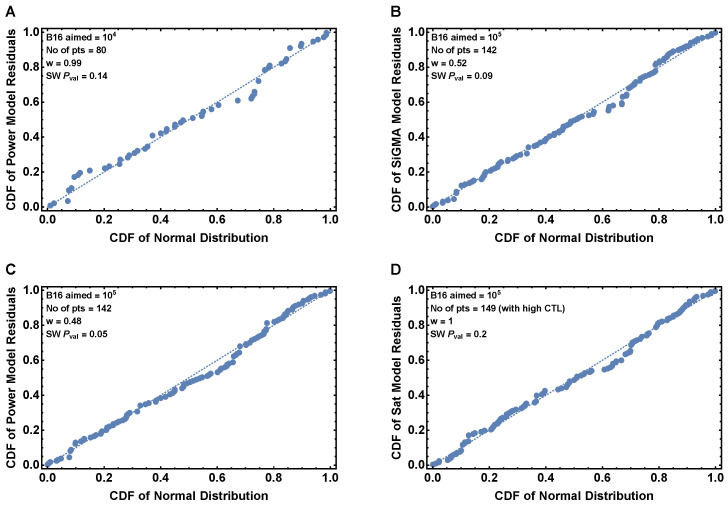
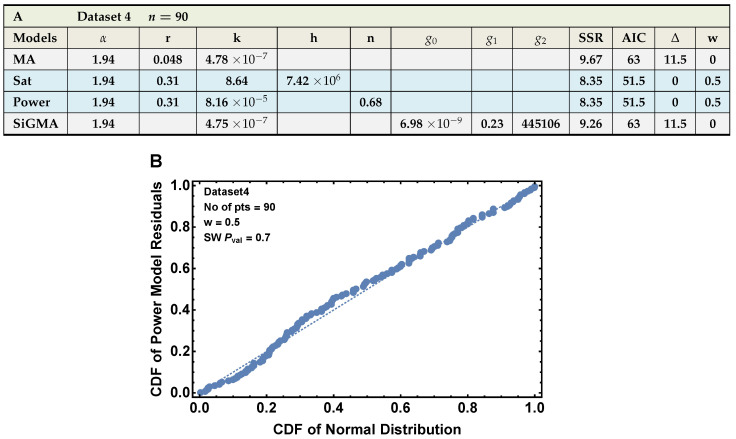
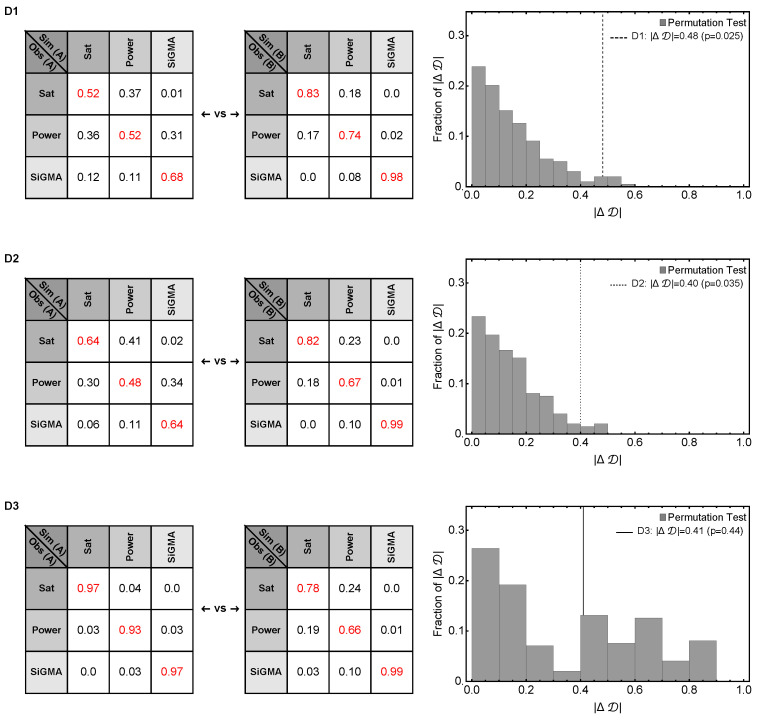
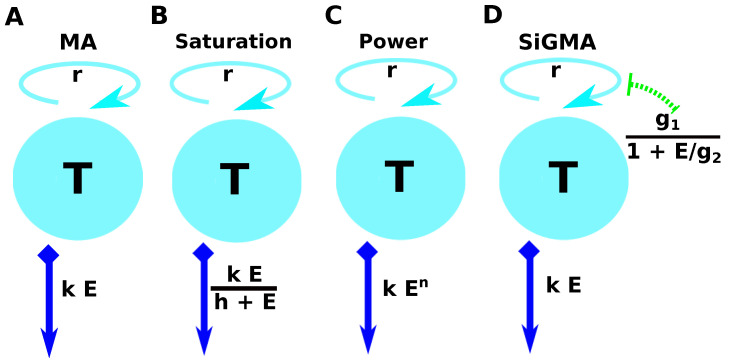
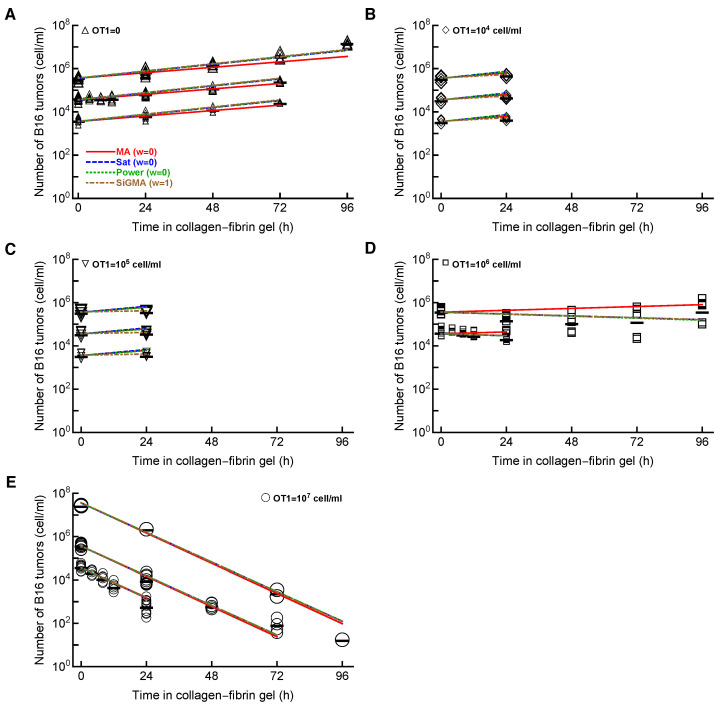
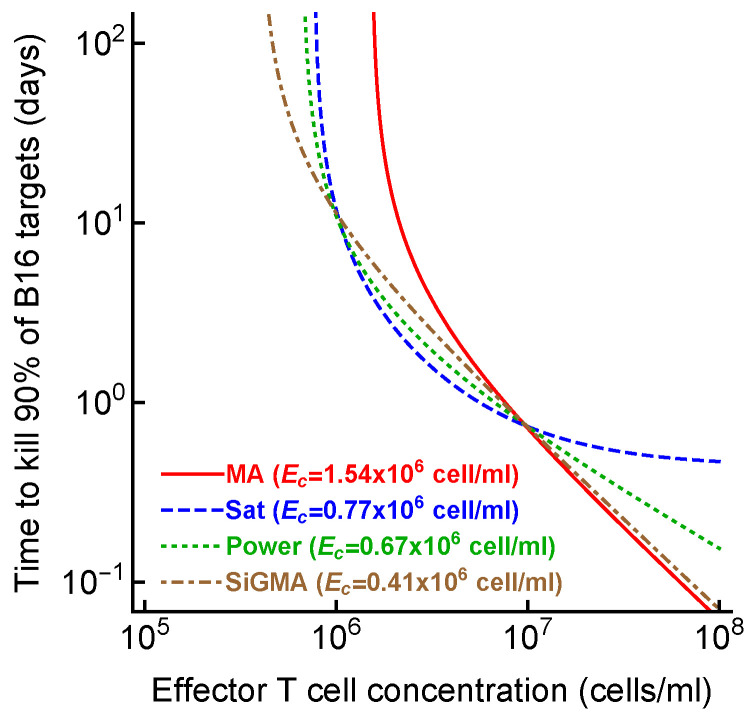
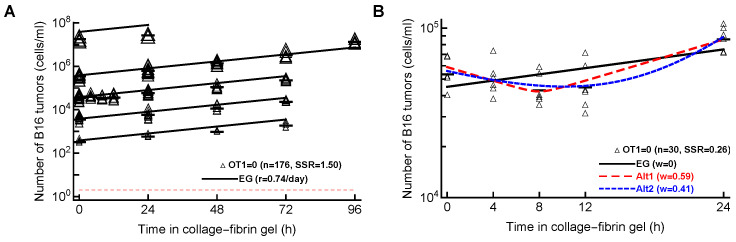
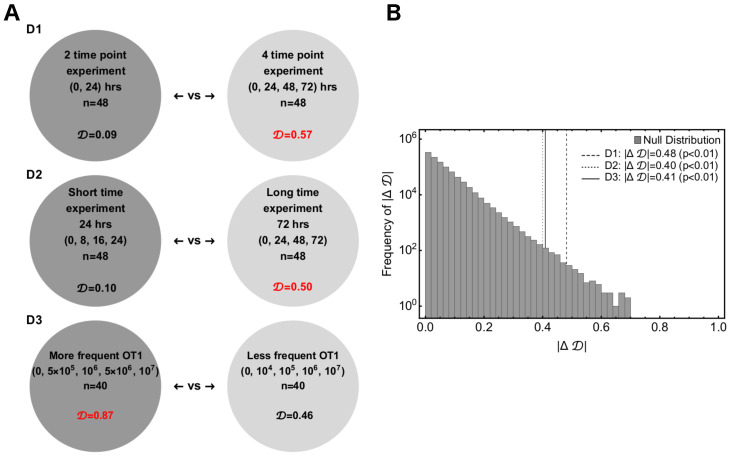
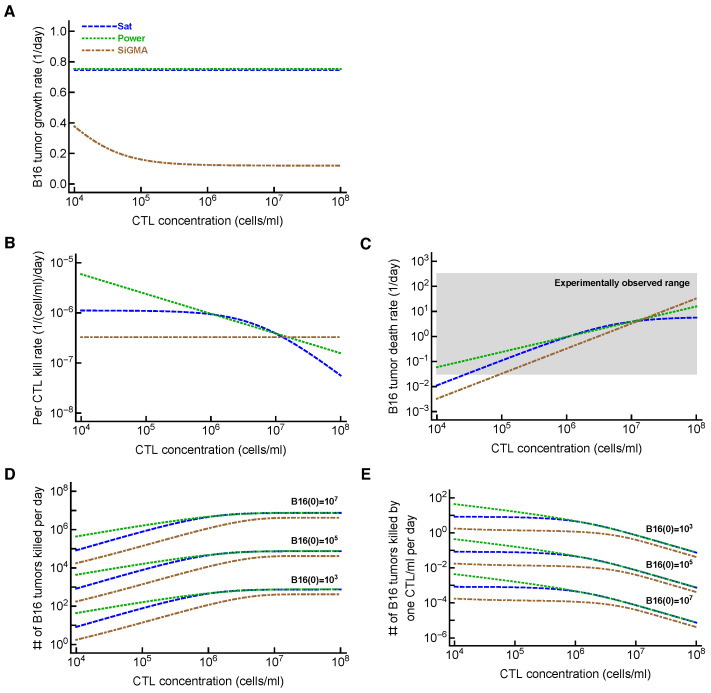
Cytotoxic T lymphocytes (CTLs) are important in controlling some viral infections, and therapies involving the transfer of large numbers of cancer-specific CTLs have been successfully used to treat several types of cancers in humans. While the molecular mechanisms of how CTLs kill their targets are relatively well understood, we still lack a solid quantitative understanding of the kinetics and efficiency by which CTLs kill their targets in vivo. Collagen-fibrin-gel-based assays provide a tissue-like environment for the migration of CTLs, making them an attractive system to study T cell cytotoxicity in in vivo-like conditions. Budhu.et al. systematically varied the number of peptide (SIINFEKL)-pulsed B16 melanoma cells and SIINFEKL-specific CTLs (OT-1) and measured the remaining targets at different times after target and CTL co-inoculation into collagen-fibrin gels. The authors proposed that their data were consistent with a simple model in which tumors grow exponentially and are killed by CTLs at a per capita rate proportional to the CTL density in the gel. By fitting several alternative mathematical models to these data, we found that this simple "exponential-growth-mass-action-killing" model did not precisely describe the data. However, determining the best-fit model proved difficult because the best-performing model was dependent on the specific dataset chosen for the analysis. When considering all data that include biologically realistic CTL concentrations (E≤107cell/mL), the model in which tumors grow exponentially and CTLs suppress tumor's growth non-lytically and kill tumors according to the mass-action law (SiGMA model) fit the data with the best quality. A novel power analysis suggested that longer experiments (∼3-4 days) with four measurements of B16 tumor cell concentrations for a range of CTL concentrations would best allow discriminating between alternative models. Taken together, our results suggested that the interactions between tumors and CTLs in collagen-fibrin gels are more complex than a simple exponential-growth-mass-action killing model and provide support for the hypothesis that CTLs' impact on tumors may go beyond direct cytotoxicity.

Keywords: B16 tumors; cytotoxic T lymphocytes; killing; mathematical modeling.


Conflict of interest statement

The authors declare no conflict of interest.

Figures

Figure A1
Figure A1
Data on the dynamics of B16 tumor cells for different time periods and at different CTL concentrations. We show all 5 datasets (Dataset 1–5, panels (AE)) analyzed in this paper. (A) Dataset 1 (growth) is on B16 tumor growth for 72 h in the absence of CTLs; (B) Dataset 2 is on B16 tumor dynamics for 24 h at different initial B16 cell and CTL concentrations (note that 5 gels had 0 B16 cells recovered, all at OT1=107cell/mL); (C) Dataset 3 is on B16 tumor dynamics for up to 96 h at different initial B16 cell and CTL concentrations (note that 8 gels had 0 B16 cells recovered at 72 and 96 h post inoculation); (D) Dataset 4 on B16 tumor dynamics in the first 24 h after inoculation at 3 different CTL concentrations, and (E) Dataset 5 (high CTL density) on B16 tumor dynamics for 24 h at 0 and 108 OT1 cell/mL. The size of markers indicates the different desired number of B16 tumor cells. The lines connect average numbers (excluding gels with 0 B16 cells in (B,C)). For each panel we also show the number of gels n and sum of squared residuals (SSR) are computed by the relation SSR=i=1N(yiy¯t)2. The red horizontal dashed line is the limit of detection for the experiments set at 2 cell/mL.
Figure A2
Figure A2
Regression analysis suggests nonlinear change of the death rate of B16 tumor cells with increasing CTL concentration. For the data in Datasets 1–4 we estimated the net rate of growth of B16 tumor cells over time rnet for every CTL and desired B16 tumor concentrations (see Figure A1 for the average rnet per CTL concentration). In the absence of CTLs, the net growth rate of tumors was rnet=r0=0.62/day. We then calculated the death rate of B16 tumor cells K by subtracting the estimated net rate of tumor change from r0, K=r0rnet. Individual symbols are estimates of K for different target B16 tumor concentrations at a given CTL level. Assuming that death rate depends on CTL concentration as power law with scale n, we estimated n for individual ranges of CTL concentrations. For example, the death rate of targets scales as KE0.25 for CTL concentrations E between 104 and 105cell/mL. The dashed line shows a linear relationship KE between the death rate of targets K and CTL concentration E as predicted by the exponential-growth-mass–action-killing model (Equation (3)). Note that values with a negative death rate K at low CTL densities were removed from the analysis.
Figure A3
Figure A3
The residuals of the best models for sub-datasets with T=104 and 105 are normally distributed. Here we show the normal probability plot of the best models of Table A4 for T=104 (A) and 105 (BD) with the p-value of the Shapiro-Wilk (SW) test.
Figure A4
Figure A4
The phenomenological Power and Sat models equally well describe the data for Dataset 4. Dataset 4 describes dynamics of B16 tumor cells within first 24 h after inoculation into collagen–fibrin gels and has n=90 data points. Parameter estimates are shown in panel A, and q-q plot for the the residuals for the models is shown in panel (B). The table details in (A) are similar to Table 1.
Figure A5
Figure A5
Statistical power to detect a difference in fit quality between alternative mathematical models depends on experimental design. We performed simulations of 3 experimental designs measuring impact of CTLs on B16 tumor dynamics (see Figure 5 and Main text for details). For designs D1 and D2 we show that the experiment type A and B are significantly different from each other. With permutation test, however, for D3 we fail to reject the null hypothesis that the experiments are similar. For three simulated experimental designs D1, D3 and D3 we simulated 100 identical replicas for investigation Type A and B from a model while choosing the errors randomly and then fit them with models. This allowed us to get matrices like the ones in the left 2 panels. The red diagonal entries show fraction of replicas generated by the a model is also best fit by the same model where as the off diagonal entries present fraction of replicas generated by a model but best fit by a different model. The experimental Type A or B with heavier diagonal terms would indicate a better experiment. In this plot we did a permutation test to compare the observed |ΔD|obs in a permutated distribution of |ΔD|per to obtain a p-value, where D is a determinant of the matrices. This test allowed us to statistically comment on the structural difference of the design Types A and B. The details of the test is discussed in the end of Results section. See Equation (12) for test statistic measure.
Figure 1
Figure 1
A schematic representation of the four main alternative models fit to data on the dynamics of B16 tumor cells. These models are as follows: (A) an exponential growth of tumors and a mass–action killing by CTLs (MA) Model (Equation (3)); (B) an exponential growth of tumors and saturation in killing by CTLs (Saturation or Sat) Model (Equation (4)); (C) an exponential growth of tumors and killing by CTLs in accord with a power law (Power) Model (Equation (5)); and (D) an exponential growth of tumors with CTL-dependent suppression of the growth and mass–action killing of tumors by CTLs (SiGMA) Model (Equation (6)). The tumor growth rate r is shown on the top of the cyan discs, which represent the B16 tumor cells T. For the suppression-in-growth model with a mass–action term in killing ((D), SiGMA), the E dependent suppression rate is presented over the green arrow. The killing rate k for each model is shown in the blue arrow pointing downwards. For example, the Power model is shown by a constant growth rate r with the death rate of the tumors due to E CTLs being kEn.
Figure 2
Figure 2
The model assuming exponential growth of B16 tumor cells and mass–action killing by CTLs is not consistent with the B16 tumor cell dynamics. We fit the mass–action killing (MA, Equation (3) and Figure 1A), saturated killing (Sat, Equation (4) and Figure 1B), power law killing (Power, Equation (5) and Figure 1C), and saturation-in-growth and mass–action killing (SiGMA, Equation (6) and Figure 1D) models to the data (Datasets 1–4, 431 gels), which included all our available data with CTL densities of ≤107 cell/mL (see Section 2 for more details). The data are shown by markers, and the lines are the predictions of the models. We show the model fits for the data for (A) OT1=0, (B) OT1=104cell/mL, (C) OT1=105cell/mL, (D) OT1=106cell/mL, and (E) OT1=107cell/mL. Parameters of the best-fit models and measures of relative model fit quality are given in Table 1; Akaike weights w for the model fits are shown in Panel A. The size of the markers denotes different desired B16 concentrations (104108 cell/mL).
Figure 3
Figure 3
The CTL concentration needed to eliminate most B16 tumor cells depends on the model of tumor control by CTLs. For every best-fit model (Table 1), we calculated the time to kill 90% of B16 targets for a given concentration of CTLs (Equation (7)) from the best-fit parameters. For every model, we also calculated the control CTL concentration (Ec) that was required to eliminate at least 90% of the tumor cells within 100 days.
Figure 4
Figure 4
Pure exponential growth (EG) model is not consistent with the data on B16 tumor dynamics in the absence of CTLs. (A) We fit with an exponential growth model (Equation (3) with E=0) to data on B16 growth from all Datasets 1–5 with OT1=0. The best-fit values for the parameters along with the 95% confidence intervals are: α=2.6(2.4–2.8) and r=0.74(0.69–0.79)/day. (B) We fit exponential growth and two alternative models (Equation (3) with E=0 and Equations (8) and (9)) to the data from Dataset 4 for which OT1=0. The relative quality of the model fits is shown by Akaike weights w (see Table A6 for model parameters and other fit quality metrics). The data are shown by markers, and model predictions are shown by lines.
Figure 5
Figure 5
Power analysis indicated that longer experiments with several, closely spaced CTL concentrations would allow finding the best discriminate between alternative models. We performed three sets of simulations to obtain insights into a hypothetical future experiment, which may allow better discriminating between alternative mathematical models. (A) The three experimental designs are: D1—2 time-point vs. 4 time-point experiments; D2—short time scale (0–24 h) vs. long time scale (0–72 h) experiments; D3—more-frequently chosen values of CTL concentrations vs. less-frequently chosen values of CTL concentrations (see Figure A5 and Section 2 for more details). For every experimental setup, we calculated D—the determinant of a matrix formed from a simulated experimental set whose columns are constrained. (B) We defined a test measure |ΔD|obs between two sets of each of D1, D2, and D3 and compared the observed |ΔD|obs with the universal null distribution of |ΔD|null to compute the p-value. The values of D in red in Panel A show the better experimental designs in the pairs.
Figure 6
Figure 6
Metrics to quantify the efficacy of CTL-mediated control of tumors are model-dependent. For the three alternative models (Sat, Power, and SiGMA) that fit some subsets of the data with the best quality, we calculated metrics that could be used to quantify the impact of CTLs on tumor growth depending on the concentration of tumor-specific CTLs. These metrics included: (A) the growth rate of the tumors (fg in Equation (1)); (B) the per capita kill rate of tumors (per 1 CTL per day, fk/E in Equation (1)); (C) the death rate of tumors due to CTL killing (fk in Equation (1)); the grey box shows the range of the experimentally observed death rates of targets as observed in some previous experiments (see Section 4 for more details and [43]); (E) the total number of tumors killed per day as a function of 3 different initial tumor cell concentrations (indicated in the panel); (D) the number of tumors killed per 1 CTL/mL per day. The latter two metrics were computed by taking the difference of the growth and combined killing at 24 h. The parameters for the models are given in Table 1, and the model equations are given in Equations (4)–(6).

Update of

References

    1. Halle S., Halle O., Forster R. Mechanisms and Dynamics of T Cell-Mediated Cytotoxicity In Vivo. Trends Immunol. 2017;38:432–443. doi: 10.1016/j.it.2017.04.002. - DOI - PubMed
    1. Halle S., Keyser K.A., Stahl F.R., Busche A., Marquardt A., Zheng X., Galla M., Heissmeyer V., Heller K., Boelter J., et al. In Vivo Killing Capacity of Cytotoxic T Cells Is Limited and Involves Dynamic Interactions and T Cell Cooperativity. Immunity. 2016;44:233–245. doi: 10.1016/j.immuni.2016.01.010. - DOI - PMC - PubMed
    1. Bossi G., Trambas C., Booth S., Clark R., Stinchcombe J., Griffiths G.M. The secretory synapse: The secrets of a serial killer. Immunol. Rev. 2002;189:152–160. doi: 10.1034/j.1600-065X.2002.18913.x. - DOI - PubMed
    1. Jenkins M.R., Tsun A., Stinchcombe J.C., Griffiths G.M. The strength of T cell receptor signal controls the polarization of cytotoxic machinery to the immunological synapse. Immunity. 2009;31:621–631. doi: 10.1016/j.immuni.2009.08.024. - DOI - PMC - PubMed
    1. Jenkins M.R., Griffiths G.M. The synapse and cytolytic machinery of cytotoxic T cells. Curr. Opin. Immunol. 2010;22:308–313. doi: 10.1016/j.coi.2010.02.008. - DOI - PMC - PubMed

Publication types

LinkOut - more resources