

SARS-CoV-2 Infection in Cities from the Southern Region of Bahia State, Brazil: Analysis of Variables Associated in Both Individual and Community Level
- PMID: 37515269
- PMCID: PMC10383252
- DOI: 10.3390/v15071583
SARS-CoV-2 Infection in Cities from the Southern Region of Bahia State, Brazil: Analysis of Variables Associated in Both Individual and Community Level
Abstract
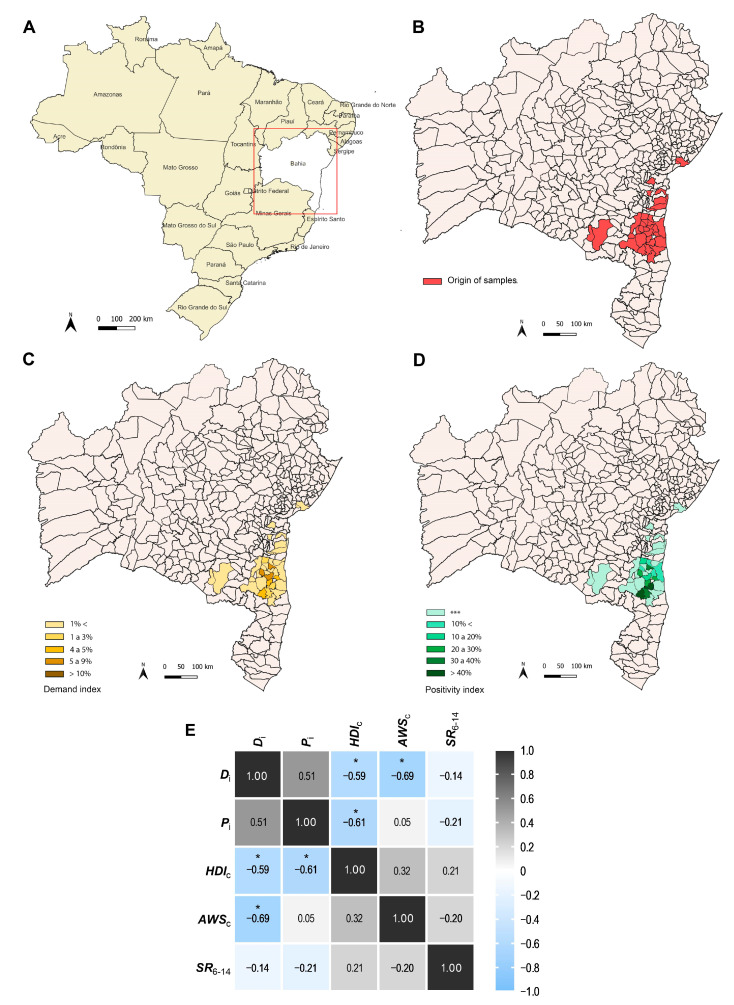
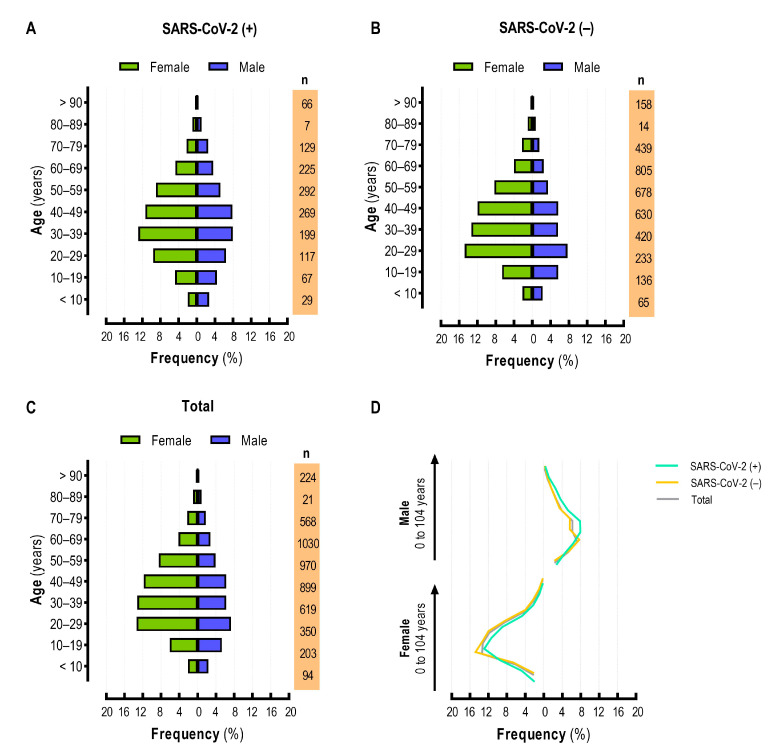
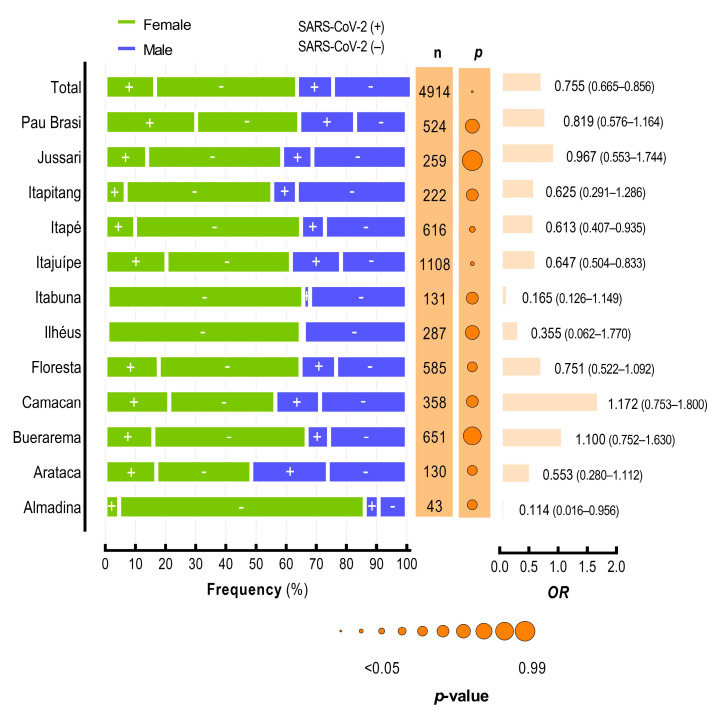
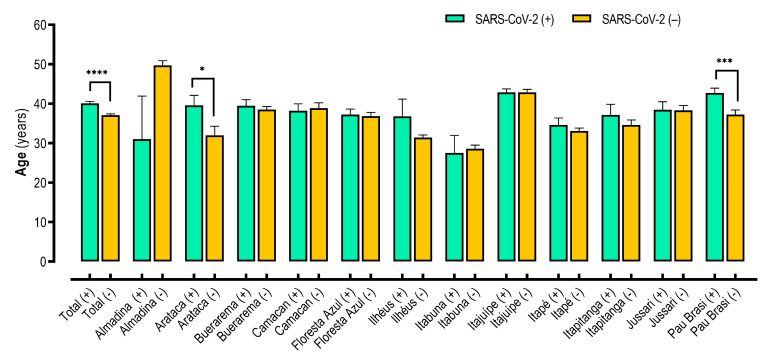
The COVID-19 pandemic, caused by the severe acute respiratory syndrome coronavirus 2 (SARS-CoV-2), challenged public health systems worldwide. Individuals in low-income countries/regions are still at individual and community risk concerning inequality, sanitation, and economic conditions. Besides, during the pandemic, the transmission in municipalities and communities in the countryside and less developed regions kept viral spread and required structured and strengthened clinical and laboratory surveillance. Here, we present an observational, analytic, cross-sectional study conducted using secondary data from the Laboratório de Farmacogenômica e Epidemiologia Molecular (LAFEM)-Universidade Estadual de Santa Cruz (UESC), to evaluate individual and community factors associated to SARS-CoV-2 infection in outpatients from different cities from Southern Region of Bahia State, in Brazil. The data were collected between June 2021 and May 2022. The SARS-CoV-2 positivity by RT-qPCR was correlated with low socio-economic indicators, including the Human development index (HDIc) and Average worker salary (AWSc). Besides, in general, females were less likely to test positive for SARS-CoV-2 (OR = 0.752; CI 95% 0.663-0.853; p < 0.0001), while brown individuals had more positivity for infection (p < 0.0001). In addition, those who had clinical symptoms were more likely to test positive for SARS-CoV-2 (OR = 6.000; CI 95% 4.932-7.299; p < 0.0001). Although dry cough, headache, and fever were the most frequent, loss of taste (OR = 5.574; CI 95% 4.334-7.186) and loss of smell (OR = 6.327; CI 95% 4.899-8.144) presented higher odds ratio to be positive to SARS-CoV-2 by RT-qPCR. Nonetheless, the distribution of these characteristics was not homogenous among the different cities, especially for age and gender. The dynamic of SARS-CoV-2 positivity differed between cities and the total population and reinforces the hypothesis that control strategies for prevention needed to be developed based on both individual and community risk levels to mitigate harm to individuals and the health system.
Keywords: COVID-19; SARS-CoV-2; community risk; epidemiology; risk factor; socio-economic status.
Conflict of interest statement
The authors declare no conflict of interest.
Figures
References
-
- Organização Pan-Americana Da Saúde—PAHO Histórico Da Pandemia De COVID-19. [(accessed on 21 November 2022)]. Available online: https://www.paho.org/pt/covid19/historico-da-pandemia-covid-19.
-
- Central Integrada De Comando E Controle Da Saúde Quadro Geral De Casos Confirmados De COVID-19 NO Estado DA Bahia. [(accessed on 22 June 2022)]; Available online: https://bi.saude.ba.gov.br/transparencia.
-
- SEI-Inicia Atualização Territorial Dos 26 Municípios Do Litoral Sul Panorama Socioeconômico Territorial. [(accessed on 26 April 2023)]; Available online: https://www.sei.ba.gov.br/index.php?option=com_content&view=article&id=1....
-
- Feehan A.K., Denstel K.D., Katzmarzyk P.T., Velasco C., Burton J.H., Price-Haywood E.G., Seoane L. Community versus individual risk of SARS-CoV-2 infection in two municipalities of Louisiana, USA: An assessment of Area Deprivation Index (ADI) paired with seroprevalence data over time. PLoS ONE. 2021;16:e0260164. doi: 10.1371/journal.pone.0260164. - DOI - PMC - PubMed
Publication types
MeSH terms
LinkOut - more resources
Full Text Sources
Medical
Miscellaneous
