. 2023 Sep 5;122(17):3458-3468.
doi: 10.1016/j.bpj.2023.07.020. Epub 2023 Jul 27.

Aha1 regulates Hsp90's conformation and function in a stoichiometry-dependent way

Affiliations

Aha1 regulates Hsp90's conformation and function in a stoichiometry-dependent way

Tanumoy Mondol et al. Biophys J. .

Abstract

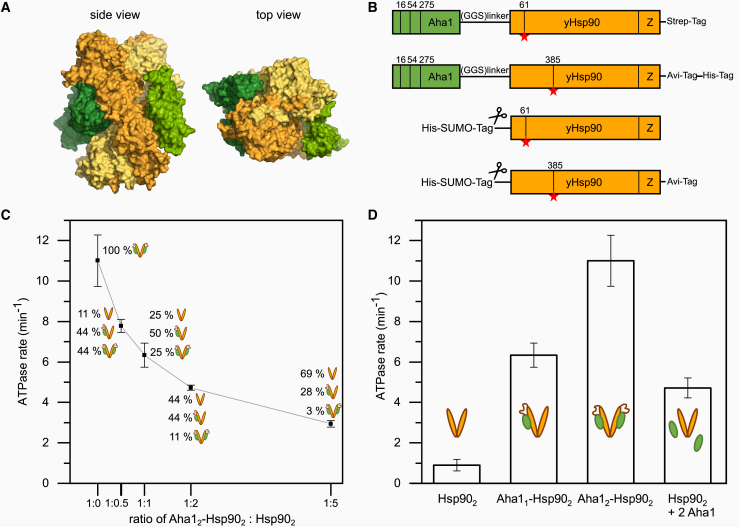
The heat shock protein 90 (Hsp90) is a molecular chaperone, which plays a key role in eukaryotic protein homeostasis. Co-chaperones assist Hsp90 in client maturation and in regulating essential cellular processes such as cell survival, signal transduction, gene regulation, hormone signaling, and neurodegeneration. Aha1 (activator of Hsp90 ATPase) is a unique co-chaperone known to stimulate the ATP hydrolysis of Hsp90, but the mechanism of their interaction is still unclear. In this report, we show that one or two Aha1 molecules can bind to one Hsp90 dimer and that the binding stoichiometry affects Hsp90's conformation, kinetics, ATPase activity, and stability. In particular, a coordination of two Aha1 molecules can be seen in stimulating the ATPase activity of Hsp90 and the unfolding of the middle domain, whereas the conformational equilibrium and kinetics are hardly affected by the stoichiometry of bound Aha1. Altogether, we show a regulation mechanism through the stoichiometry of Aha1 going far beyond a regulation of Hsp90's conformation.


Conflict of interest statement

Declaration of interests The authors declare no competing interests.

Figures

Figure 1
Figure 1
ATPase rates of Aha1-Hsp90 fusion constructs. (A) Side view and top view for a combination of Hsp90 dimer (yellows) from PDB: 6XLF and the Aha1 (greens) positions from PDB: 6XLB (cryo-EM structures) (23). (B) Schematics of the protein constructs showing the design of the Aha1-Hsp90 fusion along with the linker and Hsp90 constructs used in this study. The scissors indicate the position of the tag, which is cleaved during purification. The mutation positions are indicated as vertical lines inside. The red star denotes the position of the dyes. (C) ATPase rates of 2 μM Aha12-Hsp902 and a series of monomer exchanges of 2 μM Aha12-Hsp902 with increasing concentrations of Hsp902 starting from 1 up to 10 μM. The experiment was performed twice (n = 2). The assay was performed at 37°C in 40 mM HEPES, 10 mM MgCl2, and 150 mM KCl (pH 7.5) buffer. The line is a guide to the eye. (D) ATPase rate comparison between Hsp902, Aha11-Hsp902, Aha12-Hsp902, and Hsp902 with freely added Aha1. The schematics show the Hsp90 dimer in yellow and the Aha1 in green. Error bars represent the standard deviation of the data set. The monomer exchange of a 1:1 mixture of Aha12-Hsp902 and Hsp902 is denoted as Aha11-Hsp902, and it follows a binomial distribution of one part Aha12-Hsp902, two parts Aha11-Hsp902, and one part Hsp902. Hsp902 with freely added Aha1 (2 μM each) shows a lower ATPase due to measurement conditions being below the KD. To see this figure in color, go online.
Figure 2
Figure 2
Single-molecule FRET measurements of Hsp90 and Aha1. (A) Schematics of the smFRET TIRF setup showing an immobilized, labeled Aha12-Hsp90 dimer within the evanescent field. Fluorescence signal is separated by wavelengths using dichroic mirrors. For a Figure360 author presentation of Figure 2, see https://doi.org/10.1016/j.bpj.2023.07.020. (B) Single-molecule FRET time traces in presence of 2 mM ATP for Hsp90, Aha11-Hsp902, and Aha12-Hsp902. SmFRET trajectories show conformational dynamics in real time. Green trace represents donor fluorescence signal after donor excitation (DemDex), red trace represents acceptor fluorescence signal after donor excitation (AemDex), black traces represent acceptor fluorescence after acceptor excitation (AemAex), and blue trace represents calculated FRET efficiency (right axis). (C) FRET efficiency histogram (normalized) obtained from the smFRET traces of Hsp902 (orange line), Aha11-Hsp902 (light blue line), and Aha12-Hsp902 (dark blue line) shows the population of open and closed states. (D) Quantitative rate constants of Hsp902 (orange), Aha11-Hsp902 (light blue), and Aha12-Hsp902 (dark blue) using a four-state model for Hsp90’s conformational dynamics. (E) Kinetic models represented as graphs of the Markov chain. Conformational kinetics are depicted by four states: 0 and 1 (open states) and 2 and 3 (closed states). The assay was performed at room temperature in 40 mM HEPES, 5 mM MgCl2, and 20 mM KCl (pH 7.5) buffer condition in presence of 2 mM ATP (Hsp90: 896 traces from four independent experiments; Aha11-Hsp902: 1422 traces from four independent experiments; Aha12-Hsp902: 441 traces from two independent experiments). To see this figure in color, go online.
Figure 3
Figure 3
Optical tweezers measurements of Hsp90 with Aha1. (A) Schematic illustration of one monomer of the Aha12-Hsp902,452C construct with assigned amino acid positions at the start and end of each structural element. (B) The optical tweezers (OT) experimental setup and the interaction of Aha1 domains with each other and Hsp90apo based on PDB: 6XLB (23). Aha12-Hsp902,452C is tethered between two trapped silica beads using long DNA handles. Displayed are the Aha1 NTD (green), Aha1 CTD (green), one Hsp90 monomer in gray, and the domains of the other Hsp90 monomer in color: Hsp90 NTD (blue), Hsp90 linker (purple), Hsp90 MD (orange), and Hsp90 CTD (yellow). Introduced cysteine mutations are indicated by yellow circles. (C) Example unfolding trace (black) of Hsp90452C in constant velocity (500 nm/s) OT experiment. The trace shows first dissociation of the Hsp90 CTDs (Cdiss) and then unfolding of both Hsp90 CTDs (C) and finally unfolding of both Hsp90 part MDs (Mpart). (D) Example unfolding trace (black) of Aha12-Hsp902,452C in constant velocity (20 nm/s) OT experiments. After a first small unfolding event (see main text for details), the trace shows first dissociation of the Hsp90 CTDs (Cdiss) and then unfolding of both Hsp90 CTDs (C), followed by two additional contour length gains likely resulting from the interaction with Aha1 (A1 and A2, red arrows) and finally unfolding of a Hsp90 part MD (Mpart). Dissociation and unfolding forces are smaller than in Fig. 3C due to the lower pulling velocity. Data were analyzed using a down-sampling factor of 4. Data were boxcar average filtered using a width of 21 data points. Worm-like chain model fits are displayed by dotted lines. (E) Stoichiometry histogram of Aha1 binding to Hsp90 in Aha12-Hsp902,452C during repeated cycles of constant velocity OT experiments. Assignments of binding of either 0, 1, 1–2, or 2 Aha1 were done based on the observation of reproducible, additional contour length gains (A1, A2) observed for Aha12-Hsp902,452C in comparison to Hsp90452C. To see this figure in color, go online.

References

    1. Taipale M., Jarosz D.F., Lindquist S. HSP90 at the Hub of Protein Homeostasis: Emerging Mechanistic Insights. Nat. Rev. Mol. Cell Biol. 2010;11:515–528. doi: 10.1038/nrm2918. - DOI - PubMed
    1. Biebl M.M., Buchner J. Structure, Function, and Regulation of the Hsp90 Machinery. Cold Spring Harbor Perspect. Biol. 2019;11:a034017. - PMC - PubMed
    1. Ali M.M.U., Roe S.M., et al. Pearl L.H. Crystal Structure of an Hsp90–Nucleotide–P23/Sba1 Closed Chaperone Complex. Nature. 2006;440:1013–1017. doi: 10.1038/nature04716. - DOI - PMC - PubMed
    1. Shiau A.K., Harris S.F., et al. Agard D.A. Structural Analysis of E. Coli Hsp90 Reveals Dramatic Nucleotide-Dependent Conformational Rearrangements. Cell. 2006;127:329–340. doi: 10.1016/j.cell.2006.09.027. - DOI - PubMed
    1. Prodromou C., Panaretou B., et al. Pearl L.H. The ATPase Cycle of Hsp90 Drives a Molecular ‘Clamp’ via Transient Dimerization of the N-Terminal Domains. EMBO J. 2000;19:4383–4392. doi: 10.1093/emboj/19.16.4383. - DOI - PMC - PubMed

Publication types

MeSH terms

Substances

LinkOut - more resources