. 2023 Sep;32(9):e4741.
doi: 10.1002/pro.4741.

Diphtheria toxin-derived, anti-PD-1 immunotoxin, a potent and practical tool to selectively deplete PD-1+ cells

Affiliations

Diphtheria toxin-derived, anti-PD-1 immunotoxin, a potent and practical tool to selectively deplete PD-1+ cells

Tianxiao Zhang et al. Protein Sci. 2023 Sep.

Abstract

Programmed death-1 (PD-1), an immune checkpoint receptor, is expressed on activated lymphocytes, macrophages, and some types of tumor cells. While PD-1+ cells have been implicated in outcomes of cancer immunity, autoimmunity, and chronic infections, the exact roles of these cells in various physiological and pathological processes remain elusive. Molecules that target and deplete PD-1+ cells would be instrumental in defining the roles unambiguously. Previously, an immunotoxin has been generated for the depletion of PD-1+ cells though its usage is impeded by its low production yield. Thus, a more practical molecular tool is desired to deplete PD-1+ cells and to examine functions of these cells. We designed and generated a novel anti-PD1 diphtheria immunotoxin, termed PD-1 DIT, targeting PD-1+ cells. PD-1 DIT is comprised of two single chain variable fragments (scFv) derived from an anti-PD-1 antibody, coupled with the catalytic and translocation domains of the diphtheria toxin. PD-1 DIT was produced using a yeast expression system that has been engineered to efficiently produce protein toxins. The yield of PD-1 DIT reached 1-2 mg/L culture, which is 10 times higher than the previously reported immunotoxin. Flow cytometry and confocal microscopy analyses confirmed that PD-1 DIT specifically binds to and enters PD-1+ cells. The binding avidities between PD-1 DIT and two PD-1+ cell lines are approximately 25 nM. Moreover, PD-1 DIT demonstrated potent cytotoxicity toward PD-1+ cells, with a half maximal effective concentration (EC50 ) value of 1 nM. In vivo experiments further showed that PD-1 DIT effectively depleted PD-1+ cells and enabled mice inoculated with PD-1+ tumor cells to survive throughout the study. Our findings using PD-1 DIT revealed the critical role of pancreatic PD-1+ T cells in the development of type-1 diabetes (T1D). Additionally, we observed that PD-1 DIT treatment ameliorated relapsing-remitting experimental autoimmune encephalomyelitis (RR-EAE), a mouse model of relapsing-remitting multiple sclerosis (RR-MS). Lastly, we did not observe significant hepatotoxicity in mice treated with PD-1 DIT, which had been reported for other immunotoxins derived from the diphtheria toxin. With its remarkable selective and potent cytotoxicity toward PD-1+ cells, coupled with its high production yield, PD-1 DIT emerges as a powerful biotechnological tool for elucidating the physiological roles of PD-1+ cells. Furthermore, the potential of PD-1 DIT to be developed into a novel therapeutic agent becomes evident.

Keywords: PD-1; autoimmune diseases; cancer; diphtheria toxin-derived immunotoxin; programmed death-1 cells; protein therapeutics; yeast.


Conflict of interest statement

The authors have declared that no competing interest exists.

Figures

FIGURE 1
FIGURE 1
Design and production of PD‐1 DIT. (a) A predicted structure of PD‐1 DIT. Within PD‐1 DIT, the truncated diphtheria toxin (PDB: 1sgk) consists of a catalytic domain (cyan) and a translocation domain (cornflower blue); the two domains are connected by a disulfide bond (red) and a loop (GNRVRRSVGSSL, yellow). Two anti‐mouse PD‐1 scFvs (gray) are arranged in tandems, with pink‐colored linkers connect the light and heavy chains of the scFvs, and between two scFvs. There is also a linker (purple) connecting the toxin and the anti‐PD‐1 scFvs. (b) A series of schematic illustration demonstrating the separation of the catalytic domain from the translocation domain of the toxin and the rest of PD‐1 DIT. The first step involves the cleavage of the loop (yellow); the second step involves the reduction of the disulfide bond (red). (c) An agarose gel photograph showing the coding gene of PD‐1 DIT (Lane 1) and the double‐digestion products of the expression plasmid (Lane 2). In the lane 2, the upper band is the vector backbone, and the lower band is the coding gene of PD‐1 DIT. (d) An SDS‐PAGE gel image illustrating collected samples at different steps of PD‐1 DIT purification. Lane 1, protein ladder. Lane 2, cell culture medium which contains PD‐1 DIT. Lane 3, unbound proteins flowing off from a nickel column. Lane 4, residue proteins on the nickel column after proteins are eluted. Lane 5, eluted proteins (the red arrow is pointed to PD‐1 DIT). (e) The peak of PD‐1 DIT on size exclusion chromatography. Protein standards a, b, c, and d are β‐Amylase (150 kDa), bovine serum albumin (66 kDa), carbonic anhydrase (29 kDa), and cytochrome c (12.4 kDa), respectively. (f) An SDS‐PAGE gel photograph showing PD‐1 DIT in reduced and nonreducing states. Lane 1, protein ladder. Lane 2, PD‐1 DIT in the nonreducing state. Lane 3, protein ladder. Lane 4, PD‐1 DIT in the reduced state. In the lane 4, the upper arrow indicates PD‐1 DIT without the catalytic domain, while the lower arrow points to the catalytic domain.
FIGURE 2
FIGURE 2
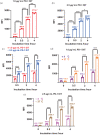
The characterization of the cellular association of PD‐1 DIT by flow cytometry. (a) The mean fluorescence intensity (MFI) of EL4 cells after incubation with Alexa Fluor 647‐labeled PD‐1 DIT (1.0 μg/mL). The mean MFL values for each treatment are labeled (N = 3). (b) The MFI of EL4 cells after incubation with Alexa Fluor 647‐labeled PD‐1 DIT (2.5 μg/mL). The mean MFL values for each treatment are labeled (N = 3). (c) Comparisons of mean MFIs between EL4 cells incubated with 1.0 μg/mL and 2.5 μg/mL of PD‐1 DIT. The mean MFL values for each treatment are labeled (N = 3). (d) Comparison of mean MFI values between EL4 cells after they are incubated with PD‐1 DIT (1.0 μg/mL) at 4°C and 37°C, respectively. The mean MFL values for each treatment are labeled (N = 3). (e) Comparison of mean MFI values between EL4 cells after they are incubated with PD‐1 DIT (2.5 μg/mL) at 4°C and 37°C, respectively. The mean MFL values for each treatment are labeled (N = 3). (Statistical significance is indicated by asterisks: *p < 0.05, ***p < 0.001, ****p < 0.0001.)
FIGURE 3
FIGURE 3
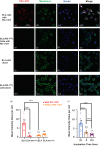
The characterization of the cellular association of PD‐1 DIT by confocal microscopy. (a–d) Confocal images of EL4 cells and (e–h) EL4 (PD‐1KO) cells after incubation with Alexa Fluor 647‐labeled PD‐1 DIT for 10 h. (i–l) Confocal images of EL4 cells and (m–p) EL4 (PD‐1KO) cells after incubation with cell culture media only for 10 h. Color code is as follows: red represents PD‐1 DIT; green represents cell membrane; blue represents nuclei. A scale bar of 20 μm is provided for reference. (q) Mean intensity value per cell (MIVpC) after cells were incubated with or without labeled PD‐1 DIT for 10 h. The data are expressed as mean ± SEM (N > 12 cells for each group). (r) Mean intensity value per cell (MIVpC) after EL4 cells were incubations with labeled PD‐1 DIT for 0.5, 2, and 10 h. The data are expressed as mean ± SEM (N > 12 cells for each group).
FIGURE 4
FIGURE 4
Depletion of PD‐1+ cells by PD‐1 DIT. (a) Viability of EL4, 2D2, and EL4 (PD‐1KO) cells after incubation with PD‐1 DIT for 72 h. The viability values are presented as mean ± SEM at various concentrations of PD‐1 DIT (N = 3). The data were fitted to the sigmoidal dose–response (variable slope) model. (b) Viability of EL4, 2D2, and EL4 (PD‐1KO) cells after incubation with PD‐1 DIT for 24 h. The viability values are presented as mean ± SEM (N = 3). The data were fitted to the sigmoidal dose–response model. (c) Viability of EL4 cells after incubation with PD‐1 DIT or CD‐3 DIT for 72 h. The viability values are shown as mean ± SEM (N = 3). The data were fitted to the sigmoidal dose–response model. (d) Fractions of EL4 cells among T lymphocytes collected from the bone marrow of mice 72 h after the last dose of treatment. The data are presented as mean ± SEM (N = 5 mice). (e) Fraction of EL4 cells among T lymphocytes collected from the blood of mice 72 h after the last dose of treatment. The data are presented as mean ± SEM (N = 5 mice).
FIGURE 5
FIGURE 5
PD‐1 DIT treatment delays the onset of T1D. (a) Numbers of PD‐1+ CD4 and CD8 T lymphocytes per islet in mice receiving PBS or PD‐1 DIT treatments. The data are presented as mean ± SEM (N = 5 mice). (b) Numbers of PD‐1+ CD4 and CD8 T effector lymphocytes per islet in mice receiving PBS or PD‐1 DIT treatments. The data are presented as mean ± SEM (N = 5 mice). (c) Numbers of PD‐1+ CD44+CD62L+ CD4 and CD8 T lymphocytes per islet in mice receiving PBS or PD‐1 DIT treatments. The data are presented as mean ± SEM (N = 5 mice). (d) An illustrative figure depicting the study design to investigate the impact of PD‐1+ cells on the progression of T1D. NOD mice received 5 doses of PD‐1 DIT or PBS once every 2 days before day 0 (black arrows). From Day 0, the mice were given 5 doses of blocking anti‐PD‐1 antibodies (B‐αPD‐1) once every 2 days (red arrows). (e) Diabetes‐free survival of NOD mice in the study described in (d) (N = 4 mice). Female (F) and male (M) NOD mice were divided into two groups and received pretreatment of PBS and PD‐1 DIT, respectively. (f) Median diabetes‐free survival days of each treatment groups in the study described in (d). The Logrank tests were used to examine difference between the PD‐1 DIT‐F and PBS‐F groups, and between the PD‐1 DIT‐M and PBS‐M groups. (g) Clinical scores of SJL/J mice with RR‐EAE that were treated with PD‐1 DIT (red dot) or PBS (black square). The black arrow indicates the day of treatments. The data at each observation day are presented as mean ± SEM (N = 15 mice). (*p < 0.05; “^” the mean clinical scores of the two groups are apparently but not significantly different; unpaired two‐tailed t‐test.)
FIGURE 6
FIGURE 6
Hepatotoxicity assessment of PD‐1 DIT. (a) Serum AST levels in mice treated with PD‐1 DIT, PBS, or APAP, respectively. Values are presented as means ± SEM (N = 5 mice). (b) Serum ALT levels in mice treated with PD‐1 DIT, PBS, or APAP, respectively. Values are presented as means ± SEM (N = 5 mice). (c) Photos of liver tissue sections. The three photographed areas represent multiple view areas from 15 tissue sections from the PD‐1 DIT, PBS, and APAP‐treated groups, respectively. The main features in the photos were consistent with other view areas we observed. The scale bar is 50 μm. (Statistical significance is indicated by asterisks: *p < 0.05; **p < 0.01; ns: not significant.)

Similar articles

Cited by

References

    1. Achiron A, Mandel M, Dreyer‐Alster S, Harari G, Magalashvili D, Sonis P, et al. Humoral immune response to COVID‐19 mRNA vaccine in patients with multiple sclerosis treated with high‐efficacy disease‐modifying therapies. Ther Adv Neurol Disord. 2021;14:17562864211012835. - PMC - PubMed
    1. Ansari MJI, Salama AD, Chitnis T, Smith RN, Yagita H, Akiba H, et al. The programmed death‐1 (PD‐1) pathway regulates autoimmune diabetes in nonobese diabetic (NOD) mice. J Exp Med. 2003;198(1):63–69. - PMC - PubMed
    1. Arata Y, Watanabe A, Motosugi R, Murakami R, Goto T, Hori S, et al. Defective induction of the proteasome associated with T‐cell receptor signaling underlies T‐cell senescence. Genes Cells. 2019;24(12):801–813. - PubMed
    1. Arndt Br, Witkowski L, Ellwart J, Seissler J. CD8+ CD122+ PD‐1− effector cells promote the development of diabetes in NOD mice. J Leucocyte Biol. 2015;97(1):111–120. - PubMed
    1. Aruna G. Immunotoxins: a review of their use in cancer treatment. J Stem Cells Regen Med. 2006;1(1):31–36. - PMC - PubMed

Publication types

LinkOut - more resources