

Motion Robust MR Fingerprinting Scan to Image Neonates With Prenatal Opioid Exposure
- PMID: 37515516
- PMCID: PMC10823040
- DOI: 10.1002/jmri.28907
Motion Robust MR Fingerprinting Scan to Image Neonates With Prenatal Opioid Exposure
Abstract
Purpose: To explore whether MR fingerprinting (MRF) scans provide motion-robust and quantitative brain tissue measurements for non-sedated infants with prenatal opioid exposure (POE).
Study type: Prospective.
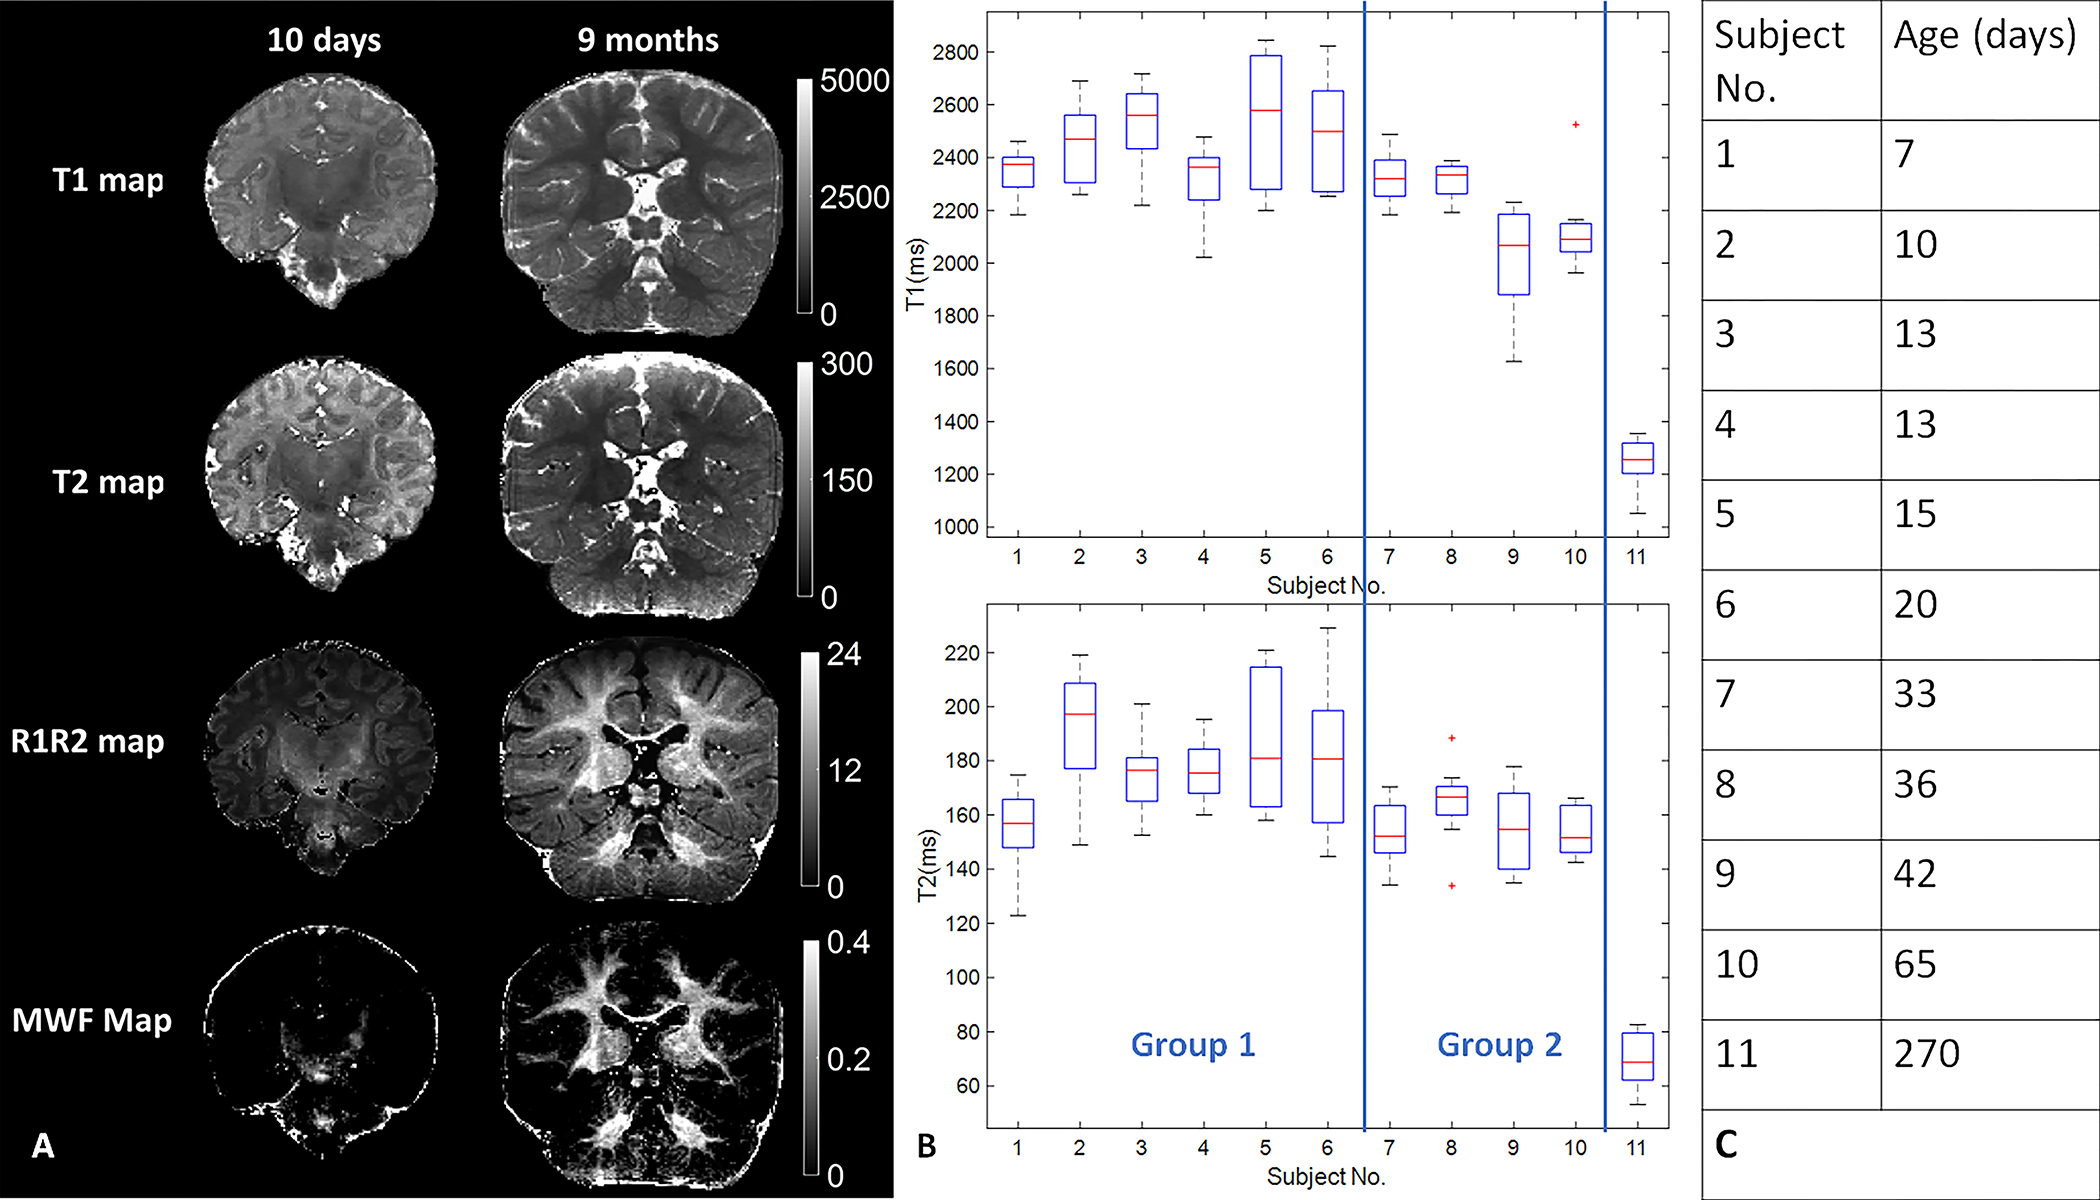
Population: 13 infants with POE (3 male; 12 newborns (age 7-65 days) and 1 infant aged 9-months).
Field strength/sequence: 3T, 3D T1-weighted MPRAGE, 3D T2-weighted TSE and MRF sequences.
Assessment: The image quality of MRF and MRI was assessed in a fully crossed, multiple-reader, multiple-case study. Sixteen image quality features in three types-image artifacts, structure and myelination visualization-were ranked by four neuroradiologists (8, 7, 5, and 8 years of experience respectively), using a 3-point scale. MRF T1 and T2 values in 8 white matter brain regions were compared between babies younger than 1 month and babies between 1 and 2 months.
Statistical tests: Generalized estimating equations model to test the significance of differences of regional T1 and T2 values of babies under 1 month and those older. MRI and MRF image quality was assessed using Gwet's second order auto-correlation coefficient (AC2) with confidence levels. The Cochran-Mantel-Haenszel test was used to assess the difference in proportions between MRF and MRI for all features and stratified by the type of features. A P value <0.05 was considered statistically significant.
Results: The MRF of two infants were excluded in T1 and T2 value analysis due to severe motion artifact but were included in the image quality assessment. In infants under 1 month of age (N = 6), the T1 and T2 values were significantly higher compared to those between 1 and 2 months of age (N = 4). MRF images showed significantly higher image quality ratings in all three feature types compared to MRI images.
Conclusions: MR Fingerprinting scans have potential to be a motion-robust and efficient method for nonsedated infants.
Level of evidence: 2 TECHNICAL EFFICACY STAGE: 1.
Keywords: MR Fingerprinting; image quality assessment; motion Robustness; neonate imaging; prenatal opioid exposure.
© 2023 The Authors. Journal of Magnetic Resonance Imaging published by Wiley Periodicals LLC on behalf of International Society for Magnetic Resonance in Medicine.
Figures


Update of
-
Motion robust MR fingerprinting scan to image neonates with prenatal opioid exposure.ArXiv [Preprint]. 2023 Jun 29:arXiv:2306.16656v1. ArXiv. 2023. Update in: J Magn Reson Imaging. 2024 May;59(5):1758-1768. doi: 10.1002/jmri.28907. PMID: 37426455 Free PMC article. Updated. Preprint.
Similar articles
-
Motion robust MR fingerprinting scan to image neonates with prenatal opioid exposure.ArXiv [Preprint]. 2023 Jun 29:arXiv:2306.16656v1. ArXiv. 2023. Update in: J Magn Reson Imaging. 2024 May;59(5):1758-1768. doi: 10.1002/jmri.28907. PMID: 37426455 Free PMC article. Updated. Preprint.
-
Initial assessment of 3D magnetic resonance fingerprinting (MRF) towards quantitative brain imaging for radiation therapy.Med Phys. 2020 Mar;47(3):1199-1214. doi: 10.1002/mp.13967. Epub 2019 Dec 30. Med Phys. 2020. PMID: 31834641
-
Physics-Informed Discretization for Reproducible and Robust Radiomic Feature Extraction Using Quantitative MRI.Invest Radiol. 2024 May 1;59(5):359-371. doi: 10.1097/RLI.0000000000001026. Epub 2023 Oct 9. Invest Radiol. 2024. PMID: 37812483 Free PMC article.
-
Magnetic resonance fingerprinting: from evolution to clinical applications.J Med Radiat Sci. 2020 Dec;67(4):333-344. doi: 10.1002/jmrs.413. Epub 2020 Jun 28. J Med Radiat Sci. 2020. PMID: 32596957 Free PMC article. Review.
-
Applications of MR Finger printing derived T1 and T2 values in Adult brain: A Systematic review.F1000Res. 2025 Jan 9;14:54. doi: 10.12688/f1000research.160088.1. eCollection 2025. F1000Res. 2025. PMID: 39839989 Free PMC article.
Cited by
-
Time-resolved MR fingerprinting for T2* signal extraction: MR fingerprinting meets echo planar time-resolved imaging.Magn Reson Med. 2025 Apr;93(4):1751-1760. doi: 10.1002/mrm.30381. Epub 2024 Nov 20. Magn Reson Med. 2025. PMID: 39567357
-
High-resolution myelin-water fraction and quantitative relaxation mapping using 3D ViSTa-MR fingerprinting.Magn Reson Med. 2024 Jun;91(6):2278-2293. doi: 10.1002/mrm.29990. Epub 2023 Dec 29. Magn Reson Med. 2024. PMID: 38156945 Free PMC article.
-
3D MR fingerprinting-derived myelin water fraction characterizing brain development and leukodystrophy.J Transl Med. 2023 Dec 15;21(1):914. doi: 10.1186/s12967-023-04788-y. J Transl Med. 2023. PMID: 38102606 Free PMC article.
-
UltimateSynth: MRI Physics for Pan-Contrast AI.bioRxiv [Preprint]. 2024 Dec 10:2024.12.05.627056. doi: 10.1101/2024.12.05.627056. bioRxiv. 2024. PMID: 39713417 Free PMC article. Preprint.
-
Efficient pulse sequence design framework for high-dimensional MR fingerprinting scans using systematic error index.Magn Reson Med. 2024 Oct;92(4):1600-1616. doi: 10.1002/mrm.30155. Epub 2024 May 9. Magn Reson Med. 2024. PMID: 38725131
References
Publication types
MeSH terms
Substances
Grants and funding
LinkOut - more resources
Full Text Sources
Research Materials
Miscellaneous
