. 2023 Oct;1869(7):166811.
doi: 10.1016/j.bbadis.2023.166811. Epub 2023 Jul 27.

Farnesoid X receptor activation inhibits pancreatic carcinogenesis

Affiliations

Farnesoid X receptor activation inhibits pancreatic carcinogenesis

Zhen Xu et al. Biochim Biophys Acta Mol Basis Dis. 2023 Oct.

Abstract

Farnesoid X receptor (FXR), a member of the nuclear receptor superfamily that controls bile acid (BA) homeostasis, has also been proposed as a tumor suppressor for breast and liver cancer. However, its role in pancreatic ductal adenocarcinoma (PDAC) tumorigenesis remains controversial. We recently found that FXR attenuates acinar cell autophagy in chronic pancreatitis resulting in reduced autophagy and promotion of pancreatic carcinogenesis. Feeding Kras-p48-Cre (KC) mice with the BA chenodeoxycholic acid (CDCA), an FXR agonist, attenuated pancreatic intraepithelial neoplasia (PanIN) progression, reduced cell proliferation, neoplastic cells and autophagic activity, and increased acinar cells, elevated pro-inflammatory cytokines and chemokines, with a compensatory increase in the anti-inflammatory response. Surprisingly, FXR-deficient KC mice did not show any response to CDCA, suggesting that CDCA attenuates PanIN progression and decelerate tumorigenesis in KC mice through activating pancreatic FXR. FXR is activated in pancreatic cancer cell lines in response to CDCA in vitro. FXR levels were highly increased in adjuvant and neoadjuvant PDAC tissue compared to healthy pancreatic tissue, indicating that FXR is expressed and potentially activated in human PDAC. These results suggest that BA exposure activates inflammation and suppresses autophagy in KC mice, resulting in reduced PanIN lesion progression. These data suggest that activation of pancreatic FXR has a protective role by reducing the growth of pre-cancerous PDAC lesions in response to CDCA and possibly other FXR agonists.

Keywords: Bile acid; Farnesoid X receptor; Pancreatic carcinogenesis; Pancreatic ductal adenocarcinoma.


Conflict of interest statement

Declaration of competing interest The authors declare that they have no known competing financial interests or personal relationships that could have appeared to influence the work reported in this paper.

Figures
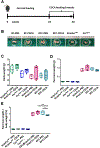
Figure 1.
Figure 1.. General physiological properties of KC and KFC mice.
(A) Protocol for breeding and CDCA feeding in KC and KFC mice. (B) Representative pancreas images for KC, KFC, FxrWT, and FxrΔpan mice. (C) Body weights of 30-week-old KC and KFC mice with normal and CDCA feeding; plotted data are means ± SEM across five mice per group. (D) Pancreas weights of 30-week-old KC and KFC mice with normal and CDCA feeding; plotted data are means ± SEM across five mice per group. (E) Pancreas weight to body weight ratios of 30-week-old KC and KFC mice with normal and CDCA feeding; plotted data are means ± SEM across five mice per group.
Figure 2.
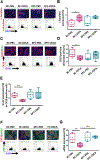
Figure 2.. Functional properties of KC and KFC tissues.
(A) Representative IF images (20× objective; scale bar = 200 μm) of pancreatic tissue stained for α-amylase (red) and 4′,6-diamidino-2-phenylindole (DAPI; blue) and fluorescence-activated cell sorting (FACS)-like scattergrams of DAPI and α-amylase quantities in the images. (B) α-amylase expression level determined by FACS-like IF quantitation; expression (in %) was plotted as means ± SEM for each group (n = 5). (C) Representative IF images (20× objective; scale bar = 200 μm) of pancreatic tissues stained for CK19 (red), Ki67 (green), and DAPI (blue) and FACS-like scattergrams of DAPI, CK19, and Ki67 quantities in the images, and their expression (in %). (D) CK19-positive cell proportions as determined by FACS-like IF quantitation plotted as means ± SEM for each group (n = 5). (E) Ki67-positive cell proportions in CK19 cells, determined by FACS-like IF quantitation via colocalization analysis, and % expression plotted as means ± SEM for each group (n = 5). (F) Representative IF images (20× objective; scale bar = 200 μm) of pancreatic tissues stained for CK19 and αSMA and FACS-like scattergrams of CK19 and αSMA quantities in the images. (G) αSMA-positive cell proportions determined by FACS-like IF quantitation plotted as means ± SEM for each group (n = 5). *, p < 0.05; **, p < 0.01.
Figure 3.
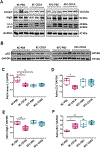
Figure 3.. Reduced pancreatic autophagy activity after exposure of mice with intact FXR to CDCA.
(A) Representative immunoblot images of LAMP2, ATG5, LC3, and glyceraldehyde 3-phosphate dehydrogenase (GAPDH; loading control). (B) Representative immunoblot images of SQSTM1 (p62) and glyceraldehyde 3-phosphate dehydrogenase (GAPDH; loading control). The protein bands with molecular masses are indicated. Normalized to (C) LAMP2, (D) LC3, (E) ATG5 and (F) p62 values plotted as means ± SEM across four animals per group. *, p < 0.05; **, p < 0.01.
Figure 4.
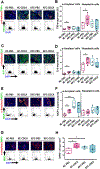
Figure 4.. Enhanced pro-inflammatory response in KC mice after BA feeding.
(A) Representative IF colocalization images (20× objective; scale bar = 100 μm) stained for α-amylase (red), TNFα (green), and DAPI (blue) and FACS-like scattergrams. (B) IF and FACS-like TNFα quantitation in acinar and neoplastic cells from KC and KFC mice pancreata and its % expression plotted as means ± SEM (n = 4–5 per group). (C) Representative IF colocalization images (20× objective; scale bar = 100 μm) stained for α-amylase (red), IL-6 (green), and DAPI (blue) and FACS-like scattergrams. (D) IF and FACS-like IL-6 quantitation in acinar and neoplastic cells from KC and KFC mice and its % expression plotted as means ± SEM (n = 4–5 per group). (E) Representative IF colocalization images (20× objective; scale bar = 100 μm) stained for α-amylase (red), MCP-1 (green), and DAPI (blue) and FACS-like scattergrams. (F) IF and FACS-like MCP-1 quantitation in acinar and neoplastic cells from KC and KFC mice pancreata and its % expression plotted as means ± SEM (n = 4–5 per group). (G) Representative IF colocalization images (20× objective; scale bar = 100 μm) stained for CK19 (red), MPO (green), and DAPI (blue) and FACS-like scattergrams. (H) IF and FACS-like quantitation of MPO-positive cells per mm2 for KC and KFC mice and % expression plotted as means ± SEM (n = 4–5 per group). *, p < 0.05; **, p < 0.01; ***, p < 0.001.
Figure 5.
Figure 5.. Enhanced anti-inflammatory response in KC mice after BA feeding.
(A) Representative IF colocalization images (20× objective; scale bar = 100 μm) stained for α-amylase (red), TGFβ (green), and DAPI (blue) and FACS-like scattergrams. (B) IF and FACS-like TGFβ quantitation in acinar and neoplastic cells from KC and KFC mice pancreata and its % expression plotted as means ± SEM (n = 4–5 per group). (C) Representative IF colocalization images (20× objective; scale bar = 100 μm) stained for α-amylase (red), IL6 (green), and DAPI (blue) and FACS-like scattergrams. (D) IF and FACS-like IL10 quantitation in acinar and neoplastic cells from KC and KFC mice pancreata and its % expression plotted as means ± SEM (n = 4–5 per group). *, p < 0.05.
Figure 6.
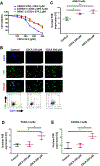
Figure 6.. Nuclear FXR activation by BAs in vitro.
(A) MTT assay showing CDCA cytotoxicity in the AR42J (IC50 = 254.7 μM), Capan-1 (IC50 = 349.7 μM), and Panc-1 (IC50 = 374.1 μM) pancreatic tumor cell lines. (B) Representative IF images (20× objective; scale bar = 50 μm) stained for FXR (green) and DAPI (blue) and FACS-like scattergrams. (C) Nuclear FXR expression in AR42J cells determined by FACS-like IF quantitation, plotted as means ± SEM (repeated thrice). (D) Nuclear FXR expression in PANC-1 cells determined by FACS-like IF quantitation, plotted as means ± SEM (repeated thrice). (E) Nuclear FXR expression in CAPAN-1 cells determined by FACS-like IF quantitation, plotted as means ± SEM (repeated triplicates). *, p < 0.05; **, p < 0.01.
Figure 7.
Figure 7.. Pancreatic BA receptor FXR expression is highly activated in pancreatic cancer patients.
(A) Representative IF colocalization images (20× objective; scale bar = 20 μm) stained for FXR (red), CK19 (green), and DAPI (blue) and FACS-like scattergrams. (B) IF and FACS-like quantitation of nuclear FXR in CK19 cells in pancreatic tissue from healthy donors (n = 9), chemo-naïve adjuvant patients (n = 9), and neoadjuvant patients (n = 18); nuclear FXR and CK19 co-expression (in %) is plotted as means ± SEM. **, p < 0.01; ***, p < 0.001; ****, p < 0.0001.

References

    1. Siegel RL, Miller KD, Fuchs HE, Jemal A, Cancer statistics, 2022, CA Cancer J Clin, 72 (2022) 7–33. - PubMed
    1. Leinwand J, Miller G, Regulation and modulation of antitumor immunity in pancreatic cancer, Nat Immunol, 21 (2020) 1152–1159. - PubMed
    1. Neoptolemos JP, Kleeff J, Michl P, Costello E, Greenhalf W, Palmer DH, Therapeutic developments in pancreatic cancer: current and future perspectives, Nat Rev Gastroenterol Hepatol, 15 (2018) 333–348. - PubMed
    1. Siegel RL, Miller KD, Fuchs HE, Jemal A, Cancer Statistics, 2021, CA Cancer J Clin, 71 (2021) 7–33. - PubMed
    1. Storz P, Acinar cell plasticity and development of pancreatic ductal adenocarcinoma, Nat Rev Gastroenterol Hepatol, 14 (2017) 296–304. - PMC - PubMed

Publication types

LinkOut - more resources