. 2023 Aug:94:104719.
doi: 10.1016/j.ebiom.2023.104719. Epub 2023 Jul 27.

Machine learning identifies signatures of macrophage reactivity and tolerance that predict disease outcomes

Affiliations

Machine learning identifies signatures of macrophage reactivity and tolerance that predict disease outcomes

Pradipta Ghosh et al. EBioMedicine. 2023 Aug.

Abstract

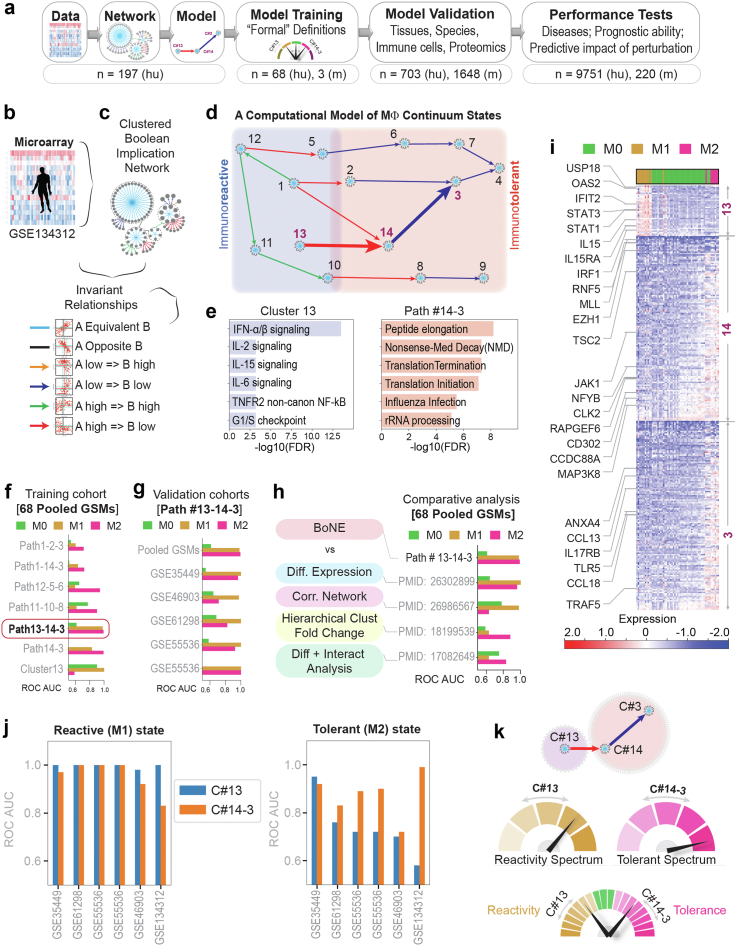
Background: Single-cell transcriptomic studies have greatly improved organ-specific insights into macrophage polarization states are essential for the initiation and resolution of inflammation in all tissues; however, such insights are yet to translate into therapies that can predictably alter macrophage fate.

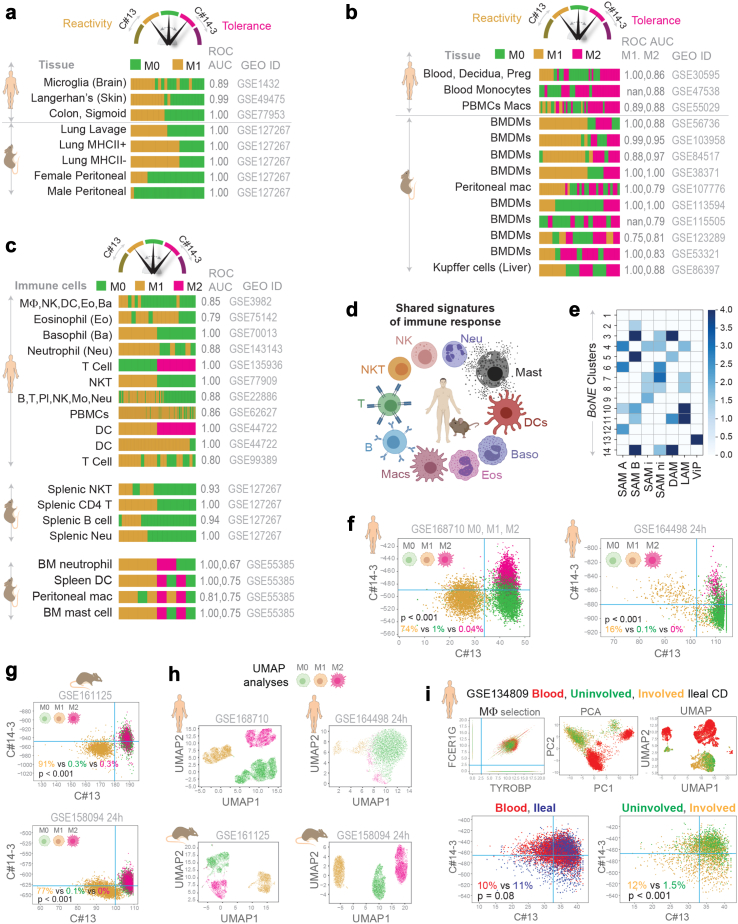
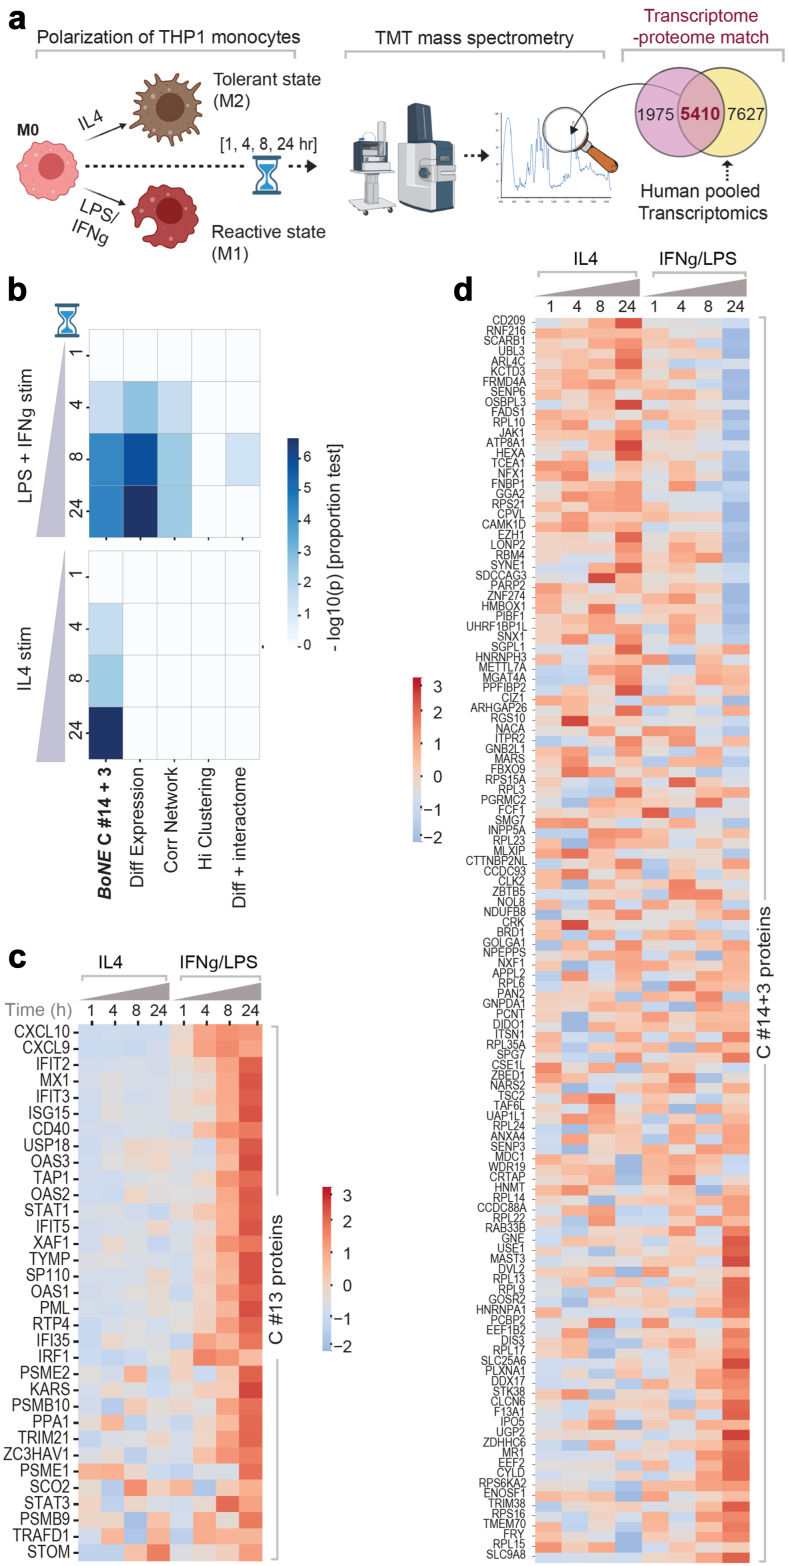
Method: Using machine learning algorithms on human macrophages, here we reveal the continuum of polarization states that is shared across diverse contexts. A path, comprised of 338 genes accurately identified both physiologic and pathologic spectra of "reactivity" and "tolerance", and remained relevant across tissues, organs, species, and immune cells (>12,500 diverse datasets).

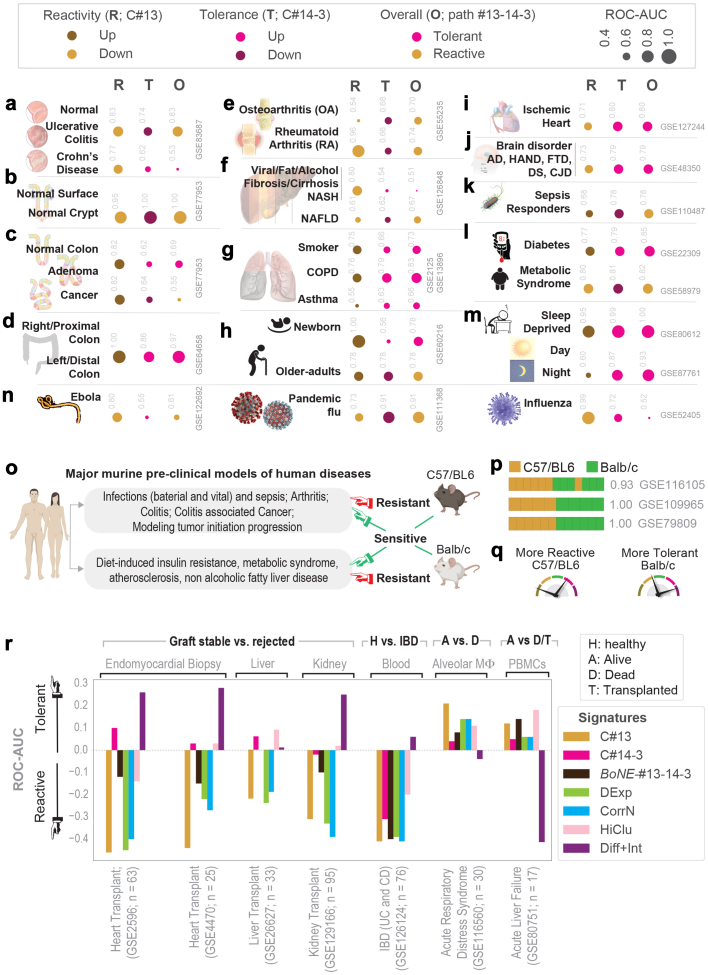
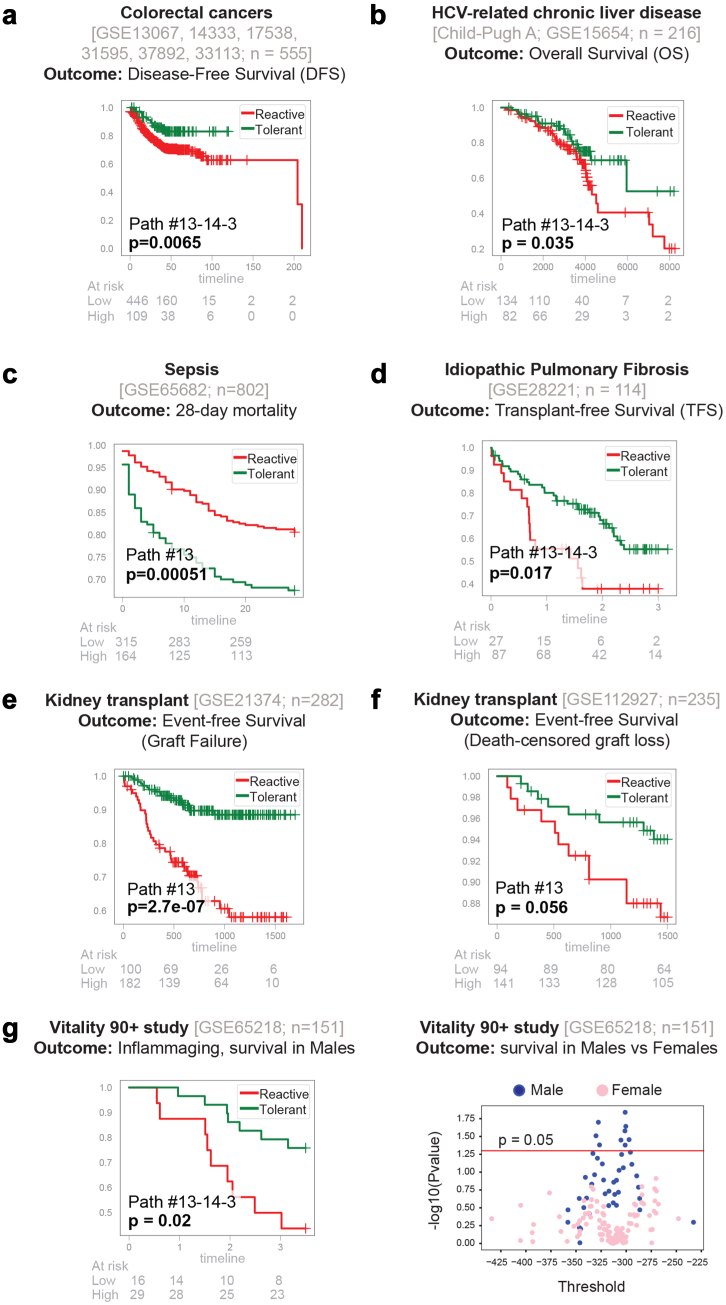
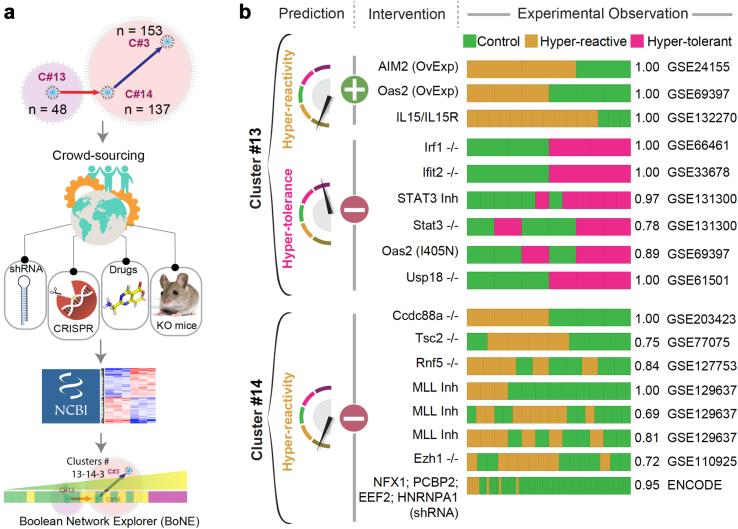
Findings: This 338-gene signature identified macrophage polarization states at single-cell resolution, in physiology and across diverse human diseases, and in murine pre-clinical disease models. The signature consistently outperformed conventional signatures in the degree of transcriptome-proteome overlap, and in detecting disease states; it also prognosticated outcomes across diverse acute and chronic diseases, e.g., sepsis, liver fibrosis, aging, and cancers. Crowd-sourced genetic and pharmacologic studies confirmed that model-rationalized interventions trigger predictable macrophage fates.

Interpretation: These findings provide a formal and universally relevant definition of macrophage states and a predictive framework (http://hegemon.ucsd.edu/SMaRT) for the scientific community to develop macrophage-targeted precision diagnostics and therapeutics.

Funding: This work was supported by the National Institutes for Health (NIH) grant R01-AI155696 (to P.G, D.S and S.D). Other sources of support include: R01-GM138385 (to D.S), R01-AI141630 (to P.G), R01-DK107585 (to S.D), and UG3TR003355 (to D.S, S.D, and P.G). D.S was also supported by two Padres Pedal the Cause awards (Padres Pedal the Cause/RADY #PTC2017 and San Diego NCI Cancer Centers Council (C3) #PTC2017). S.S, G.D.K, and D.D were supported through The American Association of Immunologists (AAI) Intersect Fellowship Program for Computational Scientists and Immunologists. We also acknowledge support from the Padres Pedal the Cause #PTC2021 and the Torey Coast Foundation, La Jolla (P.G and D.S). D.S, P.G, and S.D were also supported by the Leona M. and Harry B. Helmsley Charitable Trust.

Keywords: Artificial intelligence; Boolean equivalent clusters; Innate immune response; Macrophage; Outcome prediction; Reactive; Tolerant.


Conflict of interest statement

Declaration of interests The authors declare that they have no financial conflict of interests for this study.

Figures

Fig. 1
Fig. 1
BoNE-assisted formulation of formal definitions of macrophage polarization. a) Overview of workflow and approach used in this work. b and c) A pooled dataset of diverse human transcriptomes (b; n = 197) was used to build a Boolean implication network (c-top) and visualized as gene clusters (nodes, comprised of genes that are equivalent to each other) that are interconnected based on one of the six overwhelming Boolean implication relationship between the clusters (directed edges; c-bottom). d) Display of the major Boolean paths within the network prioritized based on the cluster size. Annotations of “immunoreactive” and “immunotolerant” ends of the spectrum are based on the expression profile of the gene clusters in 68 samples within the pooled dataset that were stimulated in vitro as M1 and M2, respectively. e) Reactome pathway analysis of each cluster along the top continuum paths was performed to identify the enriched pathways (for other clusters see http://hegemon.ucsd.edu/SMaRT/). f and g) Training (f) was performed on the 68 pooled samples using machine-learning approaches; the best-performing Boolean path, #13-14-3 was then validated (g) in multiple independent human macrophage datasets. For a list of datasets used see Supplementary Table S1. The performance was measured by computing ROC AUC for a logistic regression model. h) Comparative analysis of performance of the BoNE-derived versus other traditional approaches in segregating M0/M1/M2 polarization states. i) Heatmap displaying the pattern of gene expression in C#13, 14 and 3. Selective genes are labelled. j) Validation studies assessing the ability of the genes in either C#13 alone or C#14-3 alone to classify M0/M1/M2 polarization states in multiple human macrophage datasets. k)Top: Schematic summarizing the model-derived formal definitions of macrophage polarization states based on the levels of expression of genes in C#13 (hypo to hyper- “reactivity” spectrum) and those in C#14 + 3 (hypo to hyper- “tolerant” spectrum). Bottom: A composite score of the entire range of physiologic and pathologic response can be assessed via the BoNE-derived path #13 → 14 → 3.
Fig. 2
Fig. 2
Definitions of “reactivity” and “tolerance” are conserved across tissues, organs, species, and diverse immune cell types. a and b) Validation studies assessing the ability of SMaRT genes to classify diverse tissue-resident macrophage datasets from both humans and mice. Performance is measured by computing ROC-AUC. Barplots show the ranking order of different sample types based on the composite scores of C#13 and path #14-3. c and d) Validation studies (c) assessing the ability of SMaRT genes to classify active vs inactive states of diverse immune cell types in both humans and mice. The schematic (d) summarizes findings in c. e) Published disease-associated macrophage gene signatures (see Supplemental Information 2) are analysed for significant overlaps with various gene clusters in the Boolean map of macrophage processes. Results are displayed as heatmaps of -Log10(p) values as determined by a hypergeometric test. f and g) Scatterplots of the composite score of C#13 and path #14-3 in human (f, GSE168710, GSE164498 24 h) and mouse (g, GSE161125, GSE158094 24 h) single cell RNASeq datasets with well defined macrophage polarization states (M0, M1, M2). Blue lines correspond to the StepMiner thresholds. Percentages of different cell types are reported in the bottom-left quadrant. Pvalue is computed by two tailed two proportions z-test for M1 vs M0. h) Traditional UMAP analysis of the single cell RNASeq datasets. i) PCA, UMAP and BoNE analysis of single cell RNASeq dataset GSE134809 that includes blood and ileal biopsy (uninvolved and involved) samples from Crohn’s disease (CD) patients. Macrophages were selected as the top right corner by using thresholds (2.5, blue lines) on TYROBP and FCER1G. Blue lines correspond to the StepMiner thresholds in the scatterplot between C#13 and C#14-3 (bottom plots). Bottom-left quadrant is evaluated for enrichment of cell types across tissue (blood vs ileal) and disease states (uninvolved vs involved CD). Percentages of different cell types are reported in the bottom-left quadrant. P value is computed by two tailed two proportions z-test.
Fig. 3
Fig. 3
Definitions of “reactivity” and “tolerance” detects pathologic macrophage states in disease. Tissue immune microenvironment is visualized (in panels a–n) as bubble plots of ROC-AUC values (radii of circles are based on the ROC-AUC; Key on top) demonstrating the direction of gene regulation (Up vs Down; Key on top) for the classification of samples using BoNE-derived gene signatures of either reactive (R; C#13) or tolerant (T; C#14-3) or overall (O; path #13 → 14 → 3) in columns. The ROC-AUC values are provided next to the bubble. Sample diversity and sizes are as follows: a) IBD; GSE83687, n = 134; 60 Normal, 32 Ulcerative Colitis, 42 Crohn’s Disease. b) Colon crypt; GSE77953, 6 Normal Surface vs 7 Normal Crypt base. c); Colon cancer: Pooled colon dataset from NCBI GEO; n = 170 Normal, 68 Adenomas, 1662 CRCs. d) Colon anatomy: Proximal (right) vs distal (left) normal colon from mouse (GSE64423, n = 6) and human (GSE20881, n = 75). See Supplementary Fig. S7 for violin plots. e) Arthritis; GSE55235, GSE55457 and GSE55584, n = 79; 20 Normal, 33 Rheumatoid Arthritis, 26 Osteoarthritis. f) Hepatitis: GSE89632, n = 63; 20 fatty liver, 19 Non-alcoholic steatohepatitis (NASH) and 24 healthy, alcoholic liver disease (GSE94417, GSE94397 and GSE94399, n = 195; 109 Healthy, 13 Alcoholic Hepatitis, 6 Alcoholic fatty liver (AFL), 67 Alcoholic cirrhosis (AC) and viral hepatitis (GSE70779, n = 18; 9 Pre-treatment, 9 Post-treatment with direct-acting anti-virals). g) Chronic lung disease; GSE2125 and GSE13896, n = 115; 39 Non-smoker, 49 Smoker, 15 Asthma, 12, Chronic Obstructive Pulmonary Disease (COPD). h) Aging process; GSE60216, n = 9; 3 Newborn babies, 3 Adults, 3 Old-adults. i) Cardiomyopathy (CM), ischemic and non-ischemic (I/NI); GSE104423, n = 25 human samples; 14 NICM, 11 ICM; GSE127244, n = 24 mouse samples, 16 NICM, 8 ICM. j) Neurodegenerative brain disorders; GSE118553 (n = 401) and GSE48350 (n = 253), Alzheimer’s disease (AD); GSE35864, HIV-associated neurocognitive disorder (HAND; n = 72); GSE13162, frontotemporal dementia (FTD; n = 56); GSE59630, Down’s Syndrome (DS; n = 116); GSE124571, Creutzfeldt-Jakob Disease (CJD; n = 21). k) Systemic inflammatory response syndrome (SIRS) and sepsis; GSE63042 (n = 129); GSE110487 (n = 31). l) Type 2 diabetes and metabolic syndrome; GSE22309 (n = 110), Pre- and post-insulin treatment muscle biopsies from 20 insulin sensitive, 20 insulin resistant, 15 T2DM; GSE98895 (n = 40), PBMCs from 20 control, 20 metabolic syndrome. m) Sleep deprivation and circadian rhythm; GSE9444, n = 131 mouse brain and liver samples; GSE80612, twin, n = 22 human peripheral blood leukocytes; GSE98582, n = 555 human blood samples; GSE104674, n = 48, 24 healthy and 24 T2DM. n) Viral pandemics, such as SARS, MERS, Ebola, and others [see Supplementary Fig. S9E]. See Supplementary Fig. S8 for violin plots relevant to panels e–j. See Supplementary Fig. S9 for violin plots relevant to k–m. o–q) Schematic (o) summarizes the use of two major mouse strains (C57/B6 and Balb/c) commonly used for modeling two broad categories of human diseases. Bar plots (p) showing sample classification of genetically diverse macrophage datasets based on expression levels of genes in C#13. Schematic (q) summarizes findings. r) The diagnostic potential of various indicated gene signatures were tested on multiple datasets generated from tissues derived from patients with the known clinically relevant outcome, as indicated. In each case, BoNE-derived signatures were compared against four traditional approaches.
Fig. 4
Fig. 4
Prognostic potentials of SMaRT genes. a–g) The prognostic performance of the BoNE-derived SMaRT genes is evaluated across diverse disease conditions (colon cancer, a; liver fibrosis, b; sepsis, c; idiopathic pulmonary fibrosis, d; kidney transplantation, e and f; inflammaging, g-left). Results are displayed as Kaplan Meier (KM) curves with significance (p values) as assessed by log-rank-test. A composite immune response score is computed using Boolean path #13 → 14 → 3 or C#13 alone, as indicated within each KM plot. Low score = “reactive”; high score = “tolerant”. A threshold is computed using StepMiner by searching three options (thr, thr ± noise margin) on the immune score to separate these two states. g-right) Scatterplot between all possible thresholds of the #13 → 14 → 3 composite score and -log10 of the p value from the log-rank test for both male (blue) vs female (pink) separately. Pvalues are significant above the red line (p = 0.05). See also Supplementary Fig. S9F for other cancers (breast, prostate, pancreas, glioblastoma, and bladder).
Fig. 5
Fig. 5
SMaRT genes are differentially translated in polarized macrophages. a) Overview of the experimental design. PMA-treated human THP-1 cell lines (M0) are polarized to M1 (with LPS and IFNγ) or M2 (with IL4), followed by multiplexed mass spectrometry at indicated time points. The fraction of the global macrophage transcriptome (from the pooled 197 macrophage datasets) that is represented in the global macrophage proteome is subsequently assessed for induction (or not) of proteins that are translated by various gene signatures. b) Selectivity of induction of proteins upon LPS and IFNγ (top) or IL4 (bottom) stimulation at various timepoints was assessed across different signatures using z-test of proportions and −log (10) p values are displayed as heatmaps. c and d) z normalized Log of intensities of proteins (Supplemental Information 3) translated at different time points by genes in C#13 (c) and C#14 + 3 (d) is displayed as heatmaps.
Fig. 6
Fig. 6
Crowd-sourced assessment of the predictive potential of the SMaRT genes. a) Overview of our workflow and approach for crowd-sourced validation. Publicly available transcriptomic datasets reporting the outcome of intervention studies (genetic or pharmacologic manipulations) on macrophages/monocytes targeting any of the 185 genes in C#13 and C#14 were analysed using the BoNE platform for macrophage states. b) Predicted impact of positive (+, either overexpression [OvExp] or agonist stimulations) or negative (−; genetic −/− models, shRNA, or chemical inhibitors) interventions and observed macrophage polarization states are shown. Performance is measured by computing ROC AUC for a logistic regression model. See Supplementary Table S3.

References

    1. Pollard J.W. Trophic macrophages in development and disease. Nat Rev Immunol. 2009;9(4):259–270. - PMC - PubMed
    1. Murray P.J., Wynn T.A. Protective and pathogenic functions of macrophage subsets. Nat Rev Immunol. 2011;11(11):723–737. - PMC - PubMed
    1. Mills C.D., Kincaid K., Alt J.M., Heilman M.J., Hill A.M. M-1/M-2 macrophages and the Th1/Th2 paradigm. J Immunol. 2000;164(12):6166–6173. - PubMed
    1. Ginhoux F., Schultze J.L., Murray P.J., Ochando J., Biswas S.K. New insights into the multidimensional concept of macrophage ontogeny, activation and function. Nat Immunol. 2016;17(1):34–40. - PubMed
    1. Glass C.K., Natoli G. Molecular control of activation and priming in macrophages. Nat Immunol. 2016;17(1):26–33. - PMC - PubMed