. 2023 Sep 12;56(9):2021-2035.e8.
doi: 10.1016/j.immuni.2023.07.002. Epub 2023 Jul 28.

Ketolysis drives CD8+ T cell effector function through effects on histone acetylation

Affiliations

Ketolysis drives CD8+ T cell effector function through effects on histone acetylation

Katarzyna M Luda et al. Immunity. .

Abstract

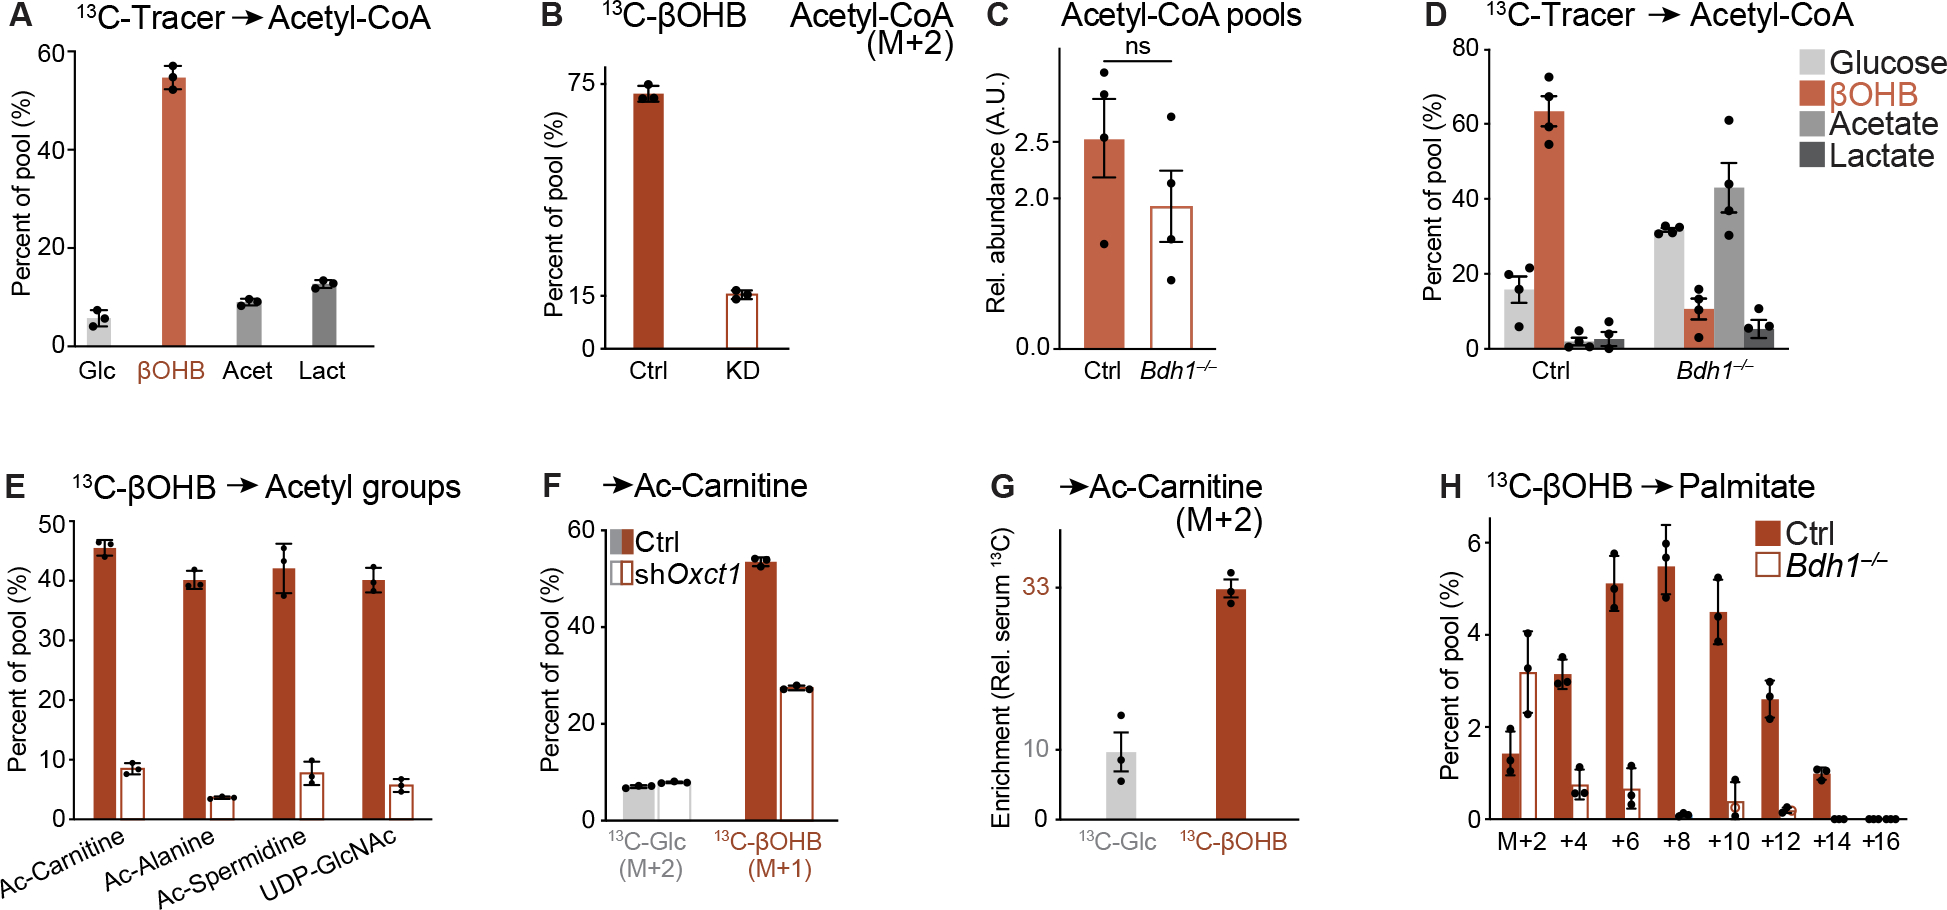
Environmental nutrient availability influences T cell metabolism, impacting T cell function and shaping immune outcomes. Here, we identified ketone bodies (KBs)-including β-hydroxybutyrate (βOHB) and acetoacetate (AcAc)-as essential fuels supporting CD8+ T cell metabolism and effector function. βOHB directly increased CD8+ T effector (Teff) cell cytokine production and cytolytic activity, and KB oxidation (ketolysis) was required for Teff cell responses to bacterial infection and tumor challenge. CD8+ Teff cells preferentially used KBs over glucose to fuel the tricarboxylic acid (TCA) cycle in vitro and in vivo. KBs directly boosted the respiratory capacity and TCA cycle-dependent metabolic pathways that fuel CD8+ T cell function. Mechanistically, βOHB was a major substrate for acetyl-CoA production in CD8+ T cells and regulated effector responses through effects on histone acetylation. Together, our results identify cell-intrinsic ketolysis as a metabolic and epigenetic driver of optimal CD8+ T cell effector responses.

Keywords: CD8(+) T cells; TCA cycle; acetyl-CoA; cancer immunology; effector function; epigenetics; ketolysis; ketone bodies; metabolism.


Conflict of interest statement

Declaration of interests R.G.J. is a scientific advisor for Agios Pharmaceuticals and Servier Pharmaceuticals and is a member of the Scientific Advisory Board of Immunomet Therapeutics.

Figures

Figure 1.
Figure 1.. Ketolysis is a metabolic feature of functional CD8+ T effector cells
(A) Pearson correlation-driven similarity matrix analysis of gene expression profiles of CD8+ T cell states. Analysis was conducted using RNA-seq datasets from three independent studies characterizing gene expression profiles of antigen-specific CD8+ T cells in infection and tumor models in vivo. (B) Rank analysis of genes enriched in dysfunctional versus functional CD8+ T cell states. Median Wald test statistics for differentially-expressed genes between Teff and Tex populations (Teff/Tex) were calculated based on tumor and virus response datasets. (C) Pathway analysis of the top 10 KEGG pathways enriched in functional Teff cells from (B). (D) Heatmap depicting mRNA expression of ketolysis pathway genes in naïve (Tn) OT-I CD8+ T cells and Lm-OVA-induced Teff (2 dpi) and Tmem (30 dpi) cells. A schematic of ketolysis is shown. (E) IFN-γ production by CD8+ T cells activated with anti-CD3 and anti-CD28 antibodies in IMDM for 3 days in the presence (+βOHB) or absence (Ctrl) of 5 mM βOHB. Left, Flow cytometry plots for CD44 versus IFN-γ expression. Right, Bar graphs showing the percentage of IFN-γ+CD8+ T cells and geometric MFI for IFN-γ. Data represent the mean ± SEM (n=3 mice/group). (F) IFN-γ production by CD8+ T cells activated with anti-CD3 and anti-CD28 antibodies in VIM for 3 days ± βOHB (0–5 mM). Left, Histograms of IFN-γ expression. Right, Bar graphs showing the percentage of IFN-γ+CD8+ T cells and the geometric MFI for IFN-γ production. Data represent the mean ± SEM (n=3 mice/group). Statistical significance was assessed by one-way ANOVA with Dunnett’s multiple comparisons test. (G) Bar graph showing the percentage of polyfunctional (TNF-α+IFN-γ+) CD8+ T cells following 3 days of activation as described in (F). Data represent the mean ± SEM (n=3 mice/group). Statistical significance was assessed by one-way ANOVA with Dunnett’s multiple comparisons test. (H) Histograms of violet proliferation dye (VPD) dilution in CD8+ T cells following 3 days of activation as described in (F) (n=3).
Figure 2.
Figure 2.. CD8+ T cell-intrinsic ketolysis is required for optimal effector function
(A) IFN-γ production by activated control (Ctrl) and Bdh1−/− CD8+ T cells isolated from Bdh1fl/fl and Bdh1fl/flCd4-Cre mice, respectively. T cells were activated with anti-CD3 and anti-CD28 antibodies in IMDM for 3 days. Left, Flow cytometry plots for CD44 versus IFN-γ expression. Right, Bar graphs showing the percentage of IFN-γ+CD8+ T cells and the geometric MFI for IFN-γ production. Data represent the mean ± SEM (n=3 mice/group). (B) Bar graphs showing the percentage of IFN-γ+CD8+ T cells and the geometric MFI for IFN-γ in Ctrl and Bdh1−/− CD8+ T cells following 3 days of activation in VIM ± 5 mM βOHB. Data represent the mean ± SEM (n=3 mice/group). (C) Cell counts for activated Ctrl and Bdh1−/− CD8+ T cells after 48 h of culture in VIM ± βOHB (normalized to Ctrl cells cultured without βOHB). Data represent the mean ± SEM (n=3 mice/group). (D) βOHB concentrations in the serum, liver, and spleen of mock-infected (uninfected) and attenuated Lm-OVA-infected mice 2 dpi. Data represent the mean ± SEM (n=8 mice/group). (E) Schematic defining ketolysis-deficient (KD) CD8+ T cells. Bdh1−/− T cells were transduced with an Oxct1-targeting shRNA to generate T cells that are unable to oxidize either βOHB or AcAc. (F) IFN-γ production by Ctrl and KD OT-I CD8+ T cells isolated from Lm-OVA-infected mice 7 dpi. Left, Flow cytometry plots for CD44 versus IFN-γ expression. Right, Percentage of IFN-γ+ OT-I CD8+ T cells and relative geometric MFI of IFN-γ expression (normalized to Ctrl cells). Data represent the mean ± SEM (n=11–12 mice/group). (G) Normalized enrichment scores (NES) of transcriptional signatures associated with CD8+ T cell subsets compared to the differentially-expressed genes in KD versus Ctrl OT-I CD8+ T cells responding to Lm-OVA (7 dpi). (H) GSEA of CD8+ T cell cytotoxicity genes in Ctrl versus KD OT-I CD8+ T cells responding to Lm-OVA (7 dpi). (I) Percentage of dead MC38-OVA cancer cells after 24 h of co-culture with activated Ctrl or Bdh1−/− OT-I CD8+ T cells at the indicated effector:target (E:T) ratio. The E:T ratio required to kill 50% of cancer cells (EC50) for each genotype is indicated. Data represent the mean ± SD (n=3/group). (J) MC38-OVA tumor growth in Bdh1fl/fl and Bdh1fl/flCd4-Cre mice. Data represent the mean ± SEM (n=5 mice/group). Statistical significance was assessed by two-way ANOVA. (K) Kaplan-Meier curve of time to humane endpoint for MC38-OVA tumor-bearing Bdh1fl/fl and Bdh1fl/flCd4-Cre mice (7–8 mice/group). Statistical significance was assessed by log-rank test.
Figure 3.
Figure 3.. KBs fuel the TCA cycle in CD8+ T cells
(A) Timecourse of βOHB uptake and cell-intrinsic βOHB production from glucose in activated CD8+ T cells. Shown is the contribution of 0.85 mM [U-13C4]-βOHB (M+4, from exogenous [U-13C4]-βOHB) or 5 mM [U-13C6]-glucose-derived βOHB (M+2) to the overall intracellular βOHB pool over time. Data represent the mean ± SD (n=3/group). (B) Heatmap representing the relative incorporation of 13C into TCA cycle metabolites derived from the indicated 13C-labeled substrates. Shown is a schematic depicting the contribution of different carbon sources to TCA cycle metabolism, with enzymes and reactions localized to the cytosol and mitochondrion indicated. (C) Mass isotopologue distribution (MID) for 5 mM [U-13C6]-glucose-, 2 mM [U-13C4]-βOHB-, or 2 mM [U-13C4]-AcAc-derived carbon into citrate and malate in activated CD8+ Teff cells after 2 h of culture. Data represent the mean ± SD (n=3/group). Statistical significance was assessed by one-way ANOVA with Dunnett’s multiple comparisons test. (D) Activated CD8+ Teff cells were cultured in VIM containing both 5 mM [U-13C6]-glucose and 2 mM [2,4-13C2]-βOHB for 2 h, and the relative contribution of 13C label from [U-13C6]-glucose (M+2) or [2,4-13C2]-βOHB (M+1) to TCA cycle metabolite pools is shown. Lactate labeling from [U-13C6]-glucose (M+3) or [2,4-13C2]-βOHB (M+1) is shown as a control. Data represent the mean ± SD (n=3/group). (E-F) Relative contribution of 13C label from [U-13C6]-glucose (M+2) or [2,4-13C2]-βOHB (M+1) into the intracellular (E) citrate or (F) malate and aspartate pools in CD8+ T cells. Cells were cultured for 2 h in VIM containing 5 mM [U-13C6]-glucose and the indicated concentration of [2,4-13C2]-βOHB. Data represent the mean ± SEM (n=3 mice/group). (G-H) Bioenergetic profile of in vitro-activated CD8+ T cells cultured with (G) 2 mM βOHB or (H) 2 mM AcAc. Left, Oxygen consumption rate (OCR) plots for activated T cells over time for βOHB and AcAc. Time of addition of oligomycin (O), FCCP (F), rotenone and antimycin A (R/A), and monensin (M) are indicated. Right, Maximal ATP production rates from OXPHOS following addition of βOHB or AcAc. T cells that received no exogenous KB substrate (Ctrl) are indicated. Data represent the mean ± SD (n=15–22/group).
Figure 4.
Figure 4.. βOHB is a physiologic fuel for CD8+ T cells
(A) Direct comparison of TCA cycle labeling from βOHB and glucose using the competitive tracing strategy described in Figure 3D. Thy1.1+OT-I CD8+ T cells were isolated from Lm-OVA-infected mice (7 dpi) and cultured ex vivo for 2 h in VIM containing 5 mM [U-13C6]-glucose and 2 mM [2,4-13C2]-βOHB. Data are presented as in Figure 3D and represent the mean ± SEM (n=4 biological replicates). (B-C) Thy1.1+OT-I CD8+ T cells isolated from Lm-OVA-infected mice (7 dpi) were cultured ex vivo for 2 h in VIM containing 5 mM [U-13C6]-glucose and the indicated concentration of [2,4-13C2]-βOHB. Relative contribution of 13C label from [U-13C6]-glucose (M+2) or [2,4-13C2]-βOHB (M+1) to the intracellular (B) citrate or (C) malate and aspartate pools in Lm-OVA-specific OT-I CD8+ T cells. Data represent the mean ± SEM (n=4 biological replicates). (D) Schematic of experimental set up for 13C infusions in attenuated Lm-OVA-infected mice using [U-13C4]-βOHB or [U-13C6]-glucose. (E) Relative contribution of infused [U-13C6]-glucose or [U-13C4]-βOHB to the intracellular βOHB (M+4) pool in Lm-OVA-specific OT-I CD8+ T cells (6 dpi). Data represent the mean ± SEM (n=3 mice/group). 13C metabolite enrichment was normalized relative to steady-state [U-13C6]-glucose (M+6) or [U-13C4]-βOHB (M+4) enrichment in serum. (F-G) Enrichment of infused [U-13C4]-βOHB-derived carbon into intracellular metabolites in Lm-OVA-specific OT-I CD8+ T cells (6 dpi). 13C metabolite enrichment was normalized relative to steady-state [U-13C4]-βOHB (M+4) enrichment in serum. Data represent the mean ± SEM (n=3 mice/group). (F) Percent of 13C enrichment from [U-13C4]-βOHB in intracellular lactate, citrate, malate, and aspartate pools. (G) MID of [U-13C4]-βOHB-derived carbon in intracellular citrate.
Figure 5.
Figure 5.. BDH1 mediates the bioenergetic effects of ketolysis in CD8+ T cells
(A) Illustration of the mitochondrial ketolysis pathway. (B) Relative contribution of 13C label from 2 mM [U-13C4]-βOHB (left) or 2 mM [U-13C4]-AcAc (right) to intracellular citrate in activated control (Ctrl) or Bdh1−/− CD8+ T cells after 2 h of culture. Data represent the mean ± SD (n=3/group). (C) Relative contribution of 13C label from 2 mM [U-13C4]-βOHB (left) or 2 mM [U-13C4]-AcAc (right) to intracellular citrate in activated CD8+ T cells expressing a control (shCtrl) or Oxct1-targeting (shOxct1) shRNA after 2 h of culture. Data represent the mean ± SD (n=3/group). (D-E) Bioenergetic profile of Bdh1−/− or shOxct1-expressing CD8+ T cells. (D) Oxygen consumption rate (OCR) plot over time for activated Ctrl or Bdh1−/− T cells cultured for 2 h ± 2 mM βOHB. Time of addition of oligomycin (O), FCCP (F), rotenone and antimycin A (R/A), and monensin (M) are indicated. (E) Maximal ATP production rates from OXPHOS in activated Bdh1−/− (left) or shOxct1-expressing (right) T cells and respective controls (Ctrl) following addition of 2 mM βOHB for 2 h. Data represent the mean ± SD (n=15–25/group).
Figure 6.
Figure 6.. βOHB is a major substrate for acetyl-CoA production in CD8+ T cells
(A) Production of acetyl-CoA in CD8+ T cells. Left, Percent enrichment of [U-13C2]-acetate, [U-13C4]-βOHB, [U-13C6]-glucose, or [U-13C3]-lactate in the intracellular acetyl-CoA (M+2) pool of activated CD8+ T cells following 24 h of culture in VIM + PCS. Data represent the mean ± SD (n=3/group). (B) Percent enrichment of 2 mM [13C4]-βOHB in the acetyl-CoA (M+2) pool in control (Ctrl) and ketolysis-deficient (KD) CD8+ T cells after 24 h of culture. Data represent the mean ± SD (n=3/group). (C) Acetyl-CoA pool size in Ctrl and Bdh1−/− CD8+ T cells cultured in VIM + PCS for 24 h. Data represent the mean ± SEM (n=4 mice/group). A.U., arbitrary unit. (D) Percent enrichment of [U-13C2]-acetate, [U-13C4]-βOHB, [U-13C6]-glucose, or [U-13C3]-lactate in the intracellular acetyl-CoA (M+2) pool of activated Ctrl and Bdh1−/− CD8+ T cells following 24 h of culture in VIM + PCS. Data represent the mean ± SEM (n=4 mice/group). (E) Percent enrichment of 2 mM [U-13C4]-βOHB carbon in acetylated (M+2) metabolites from Ctrl and Bdh1−/− CD8+ T cells after 24 h of culture. Data represent the mean ± SD (n=3/group). (F) Relative 13C contribution from 5 mM [U-13C6]-glucose (M+2) or 2 mM [2,4-13C2]-βOHB (M+1) to the acetyl-carnitine pool in activated CD8+ T cells expressing a control (Ctrl) or Oxct1-targeting (shOxct1) shRNA after 2 h of culture. Data represent the mean ± SD (n=3/group). (G) Enrichment of 13C carbon from 5 mM [U-13C6]-glucose or 2 mM [U-13C4]-βOHB in acetyl-carnitine (M+2) in OT-I CD8+ T cells following 2 h infusion of Lm-OVA-infected mice (6 dpi, as in Figure 4D). Enrichment was normalized relative to steady-state [U-13C6]-glucose (M+6) and [U-13C4]-βOHB (M+4) enrichment in serum, respectively. Data represent the mean ± SEM (n=3 mice/group). (H) MID of [U-13C4]-βOHB-derived 13C in palmitate in activated Ctrl and Bdh1−/− CD8+ T cells after 24 h of culture. Data represent the mean ± SD (n=3/group).
Figure 7.
Figure 7.. βOHB alters histone acetylation in CD8+ T cells
(A) Relative abundance of Ifng mRNA in control (Ctrl) and Bdh1−/− CD8+ T cells activated for 3 days in the presence (+) or absence (−) of 5 mM βOHB. Data represent the mean ± SEM (n=3 mice/group). (B) Relative abundance of Ifng and Gzmb mRNA in activated Ctrl and ketolysis-deficient (KD) OT-I CD8+ T cells. Data represent the mean ± SD (n=3/group). (C) Heatmap of differentially-expressed effector gene transcripts (p<0.05) altered in Ctrl and KD OT-I CD8+ Teff cells isolated from Lm-OVA-infected mice 7 dpi (n=3 mice/group). (D) Immunoblot of acetylated histone H3 in lysates from activated Ctrl and KD OT-I CD8+ T cells. Total H3 is shown as a control for protein loading. (E) Immunoblot of global histone H3 acetylation (H3Ac) and specific acetylation at Lys14 (H3K14Ac) and Lys27 (H3K27Ac) in activated wild type (WT) CD8+ T cells ± 5 mM βOHB for 24 h. (F) Immunoblot for H3 and H3K27Ac in activated Ctrl and Bdh1−/− CD8+ T cells ± 5 mM βOHB for 24 h. (G) Mass spectra of histone H3 (peptide 27–40) from activated Ctrl or Bdh1−/− CD8+ T cells cultured with 5 mM [U-13C4]-βOHB for 24 h. Peaks corresponding to unlabeled (12C) and 13C-labeled H3K27Ac peptides are highlighted in green. Data are representative of technical triplicates. (H) Heatmap quantifying [U-13C4]-βOHB-derived acetylation of histones H3 and H4 from activated Ctrl and Bdh1−/− CD8+ T cells cultured with 5 mM [U-13C4]-βOHB for 24 h. For histone H4, the number of acetylated lysine residues on peptides containing Lys5/8/12/16 are quantified individually. (I) Data tracks for H3K27Ac peak enrichment at Ifng and Gzmb gene loci for 24 h-activated Ctrl and Bdh1−/− CD8+ T cells. H3K27Ac peak enrichment is shown in green, with ATAC-seq tracks highlighting regions of chromatin accessibility in in vivo Tn and Teff cells shown in black. Data are representative of duplicate samples. (J) IFN-γ production by Ctrl or Bdh1−/− CD8+ T cells in the presence or absence of the HAT inhibitor (HATi) A485. Ctrl and Bdh1−/− CD8+ T cells were activated for 3 days as in Figure 1F in VIM containing 2 mM βOHB. A485 (1 μM) was added 4 h prior to restimulation with PMA/ionomycin. Left, Histograms of IFN-γ expression. Right, Bar graph showing the percentage of IFN-γ+CD8+ T cells. Data represent the mean ± SD (n=6 technical replicates from 2 mice).

References

    1. Williams MA, and Bevan MJ (2007). Effector and memory CTL differentiation. Annu. Rev. Immunol. 25, 171–192. - PubMed
    1. Philip M, and Schietinger A (2022). CD8+ T cell differentiation and dysfunction in cancer. Nat. Rev. Immunol. 22, 209–223. - PMC - PubMed
    1. Pearce EL, Poffenberger MC, Chang C-H, and Jones RG (2013). Fueling immunity: insights into metabolism and lymphocyte function. Science 342, 1242454. - PMC - PubMed
    1. O’Neill LAJ, Kishton RJ, and Rathmell J (2016). A guide to immunometabolism for immunologists. Nat. Rev. Immunol. 16, 553–565. - PMC - PubMed
    1. Chapman NM, and Chi H (2022). Metabolic adaptation of lymphocytes in immunity and disease. Immunity 55, 14–30. - PMC - PubMed

Publication types