. 2023 Aug 9;31(8):1371-1385.e6.
doi: 10.1016/j.chom.2023.07.003. Epub 2023 Jul 28.

A mucin-regulated adhesin determines the spatial organization and inflammatory character of a bacterial symbiont in the vertebrate gut

Affiliations

A mucin-regulated adhesin determines the spatial organization and inflammatory character of a bacterial symbiont in the vertebrate gut

T Jarrod Smith et al. Cell Host Microbe. .

Abstract

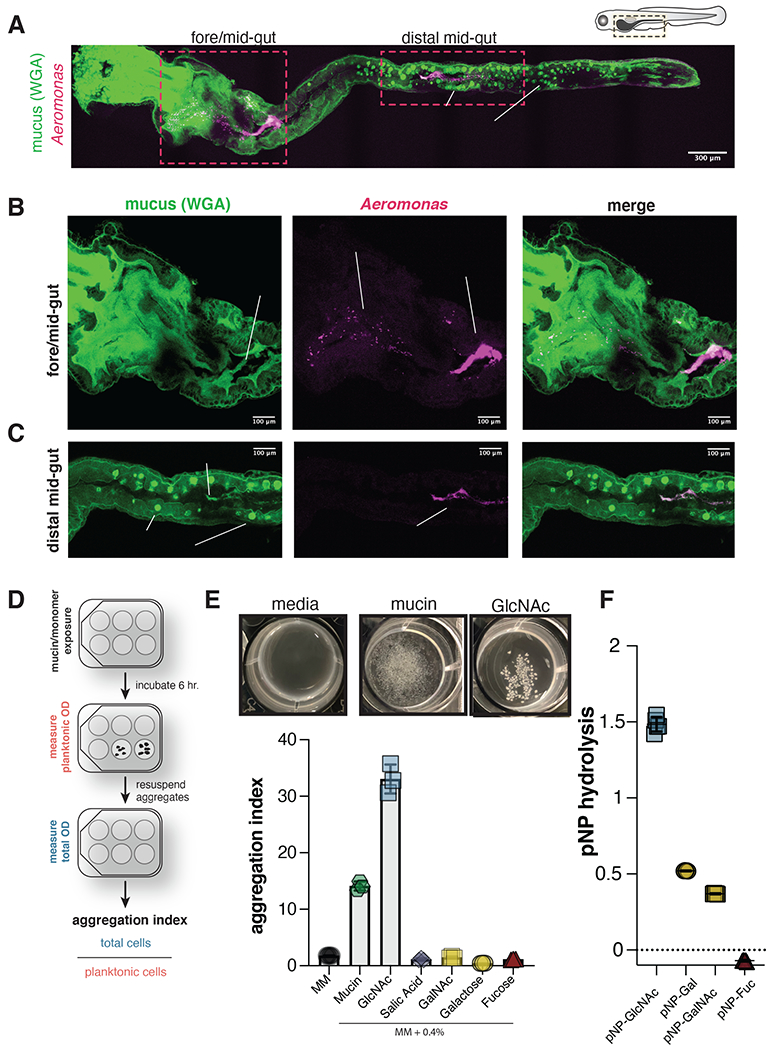
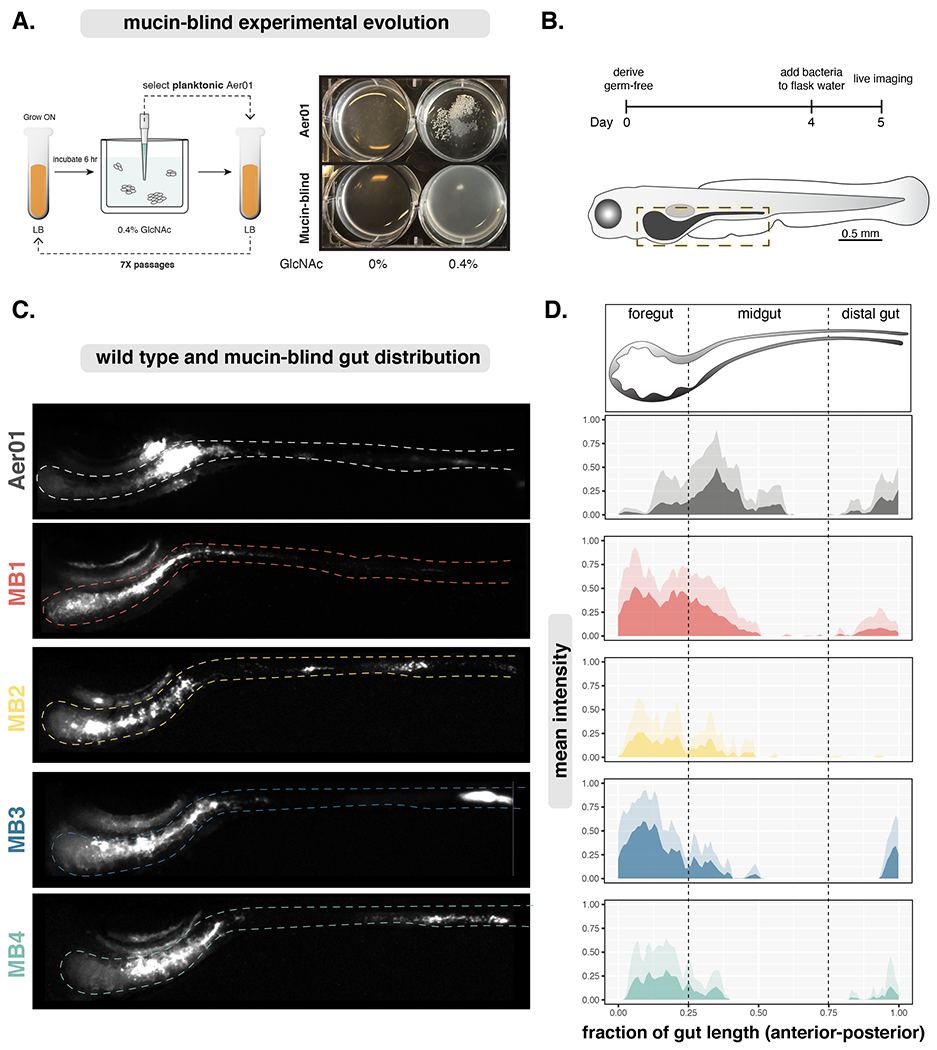
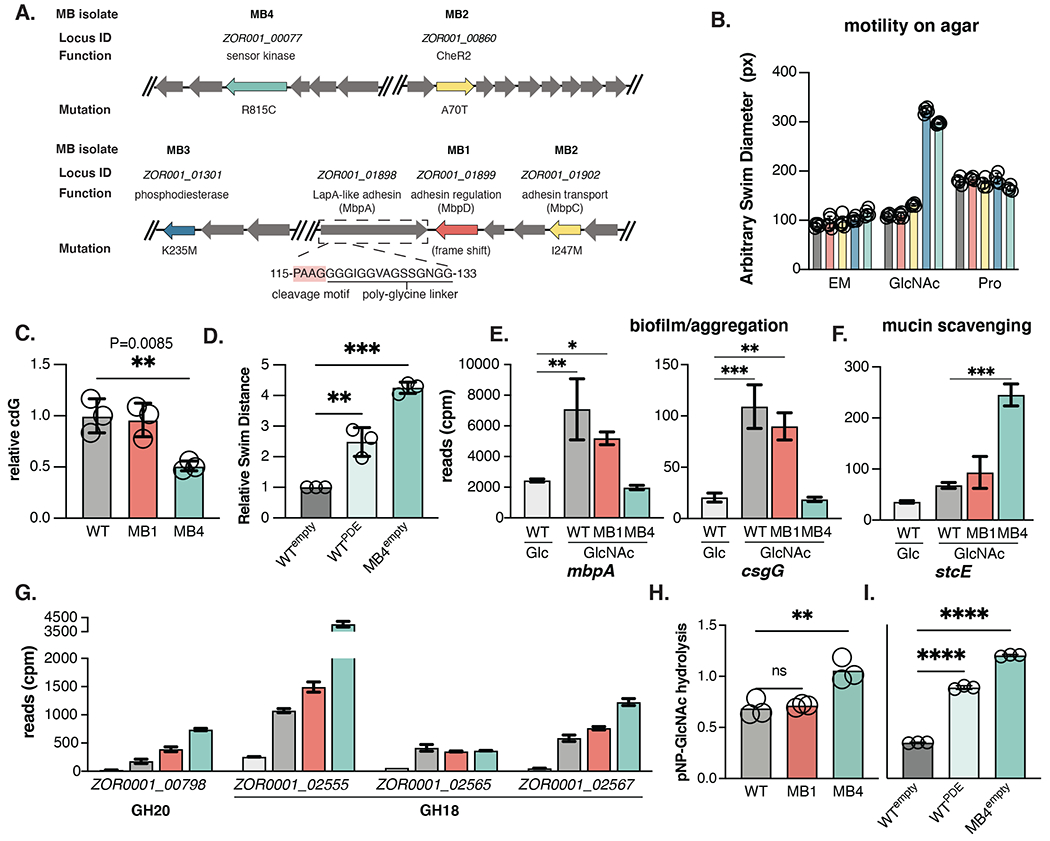
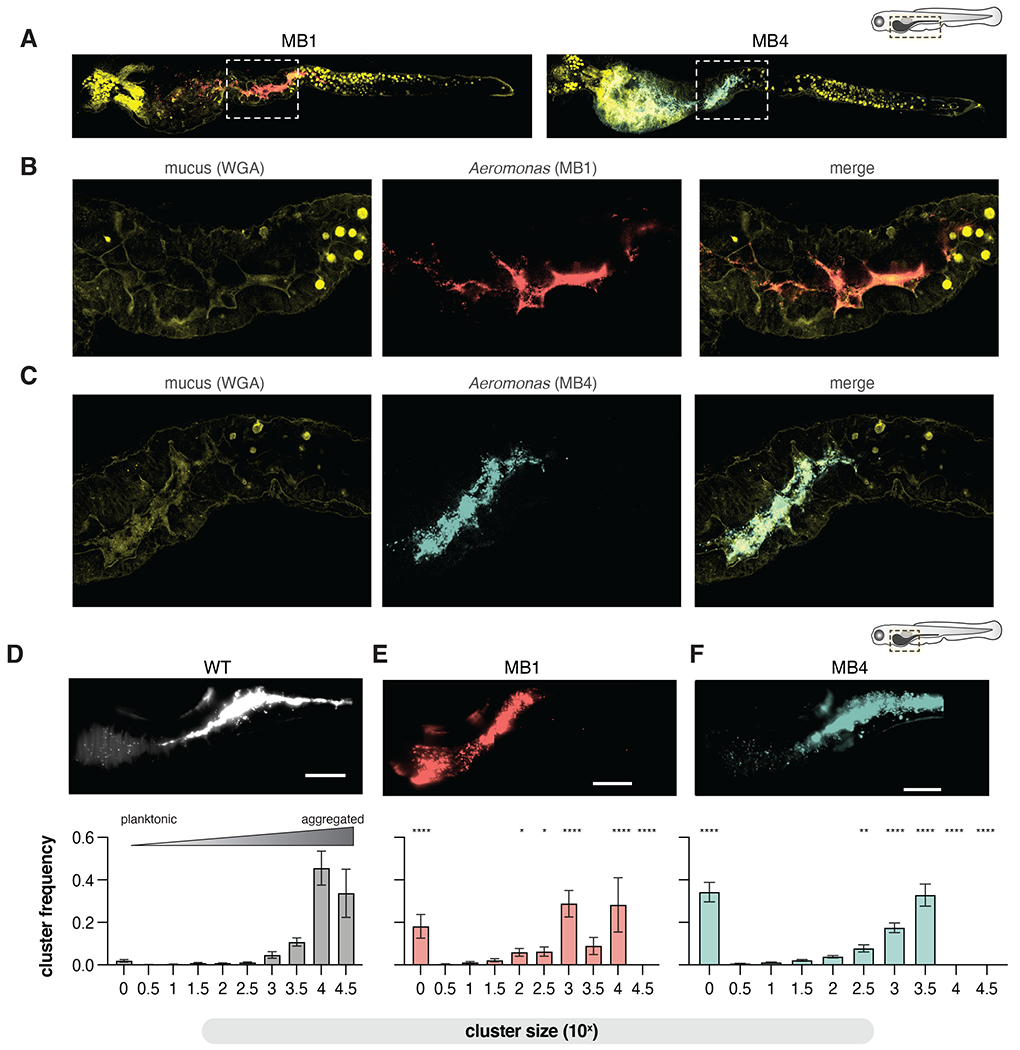
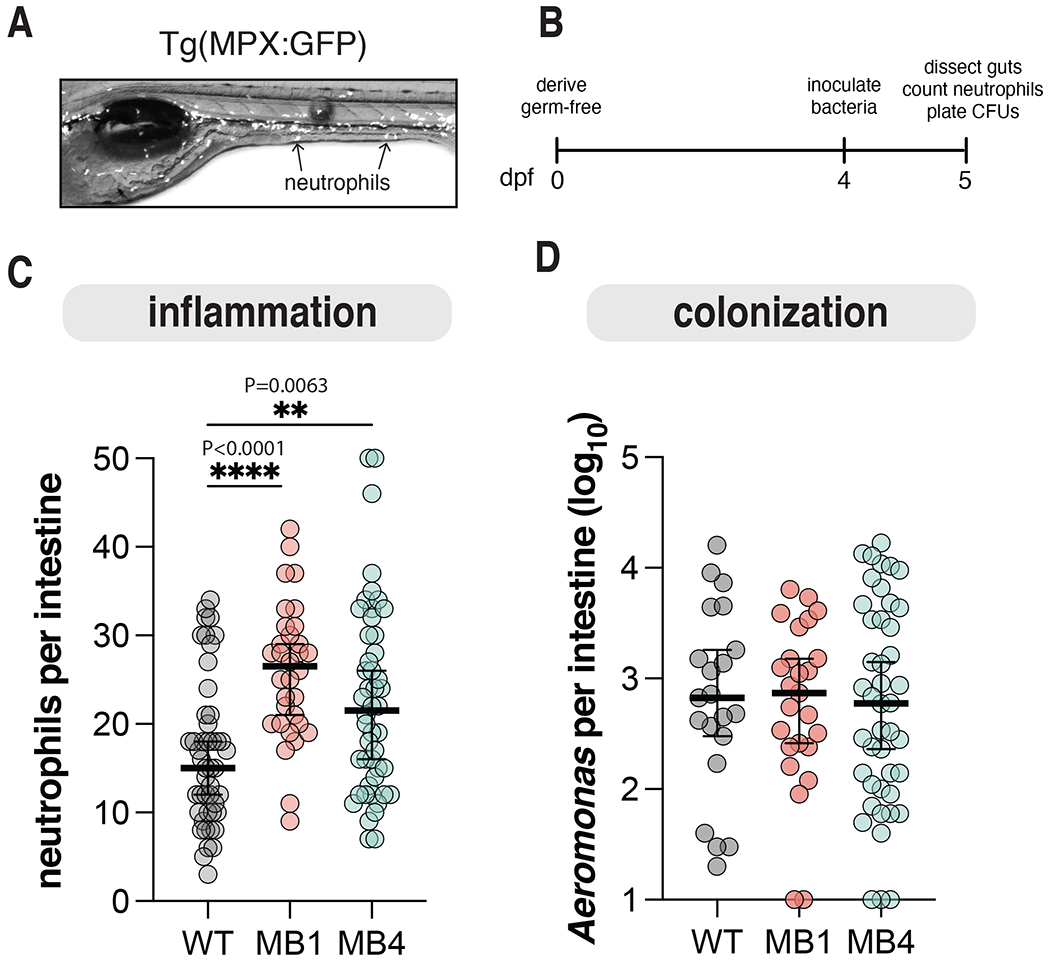
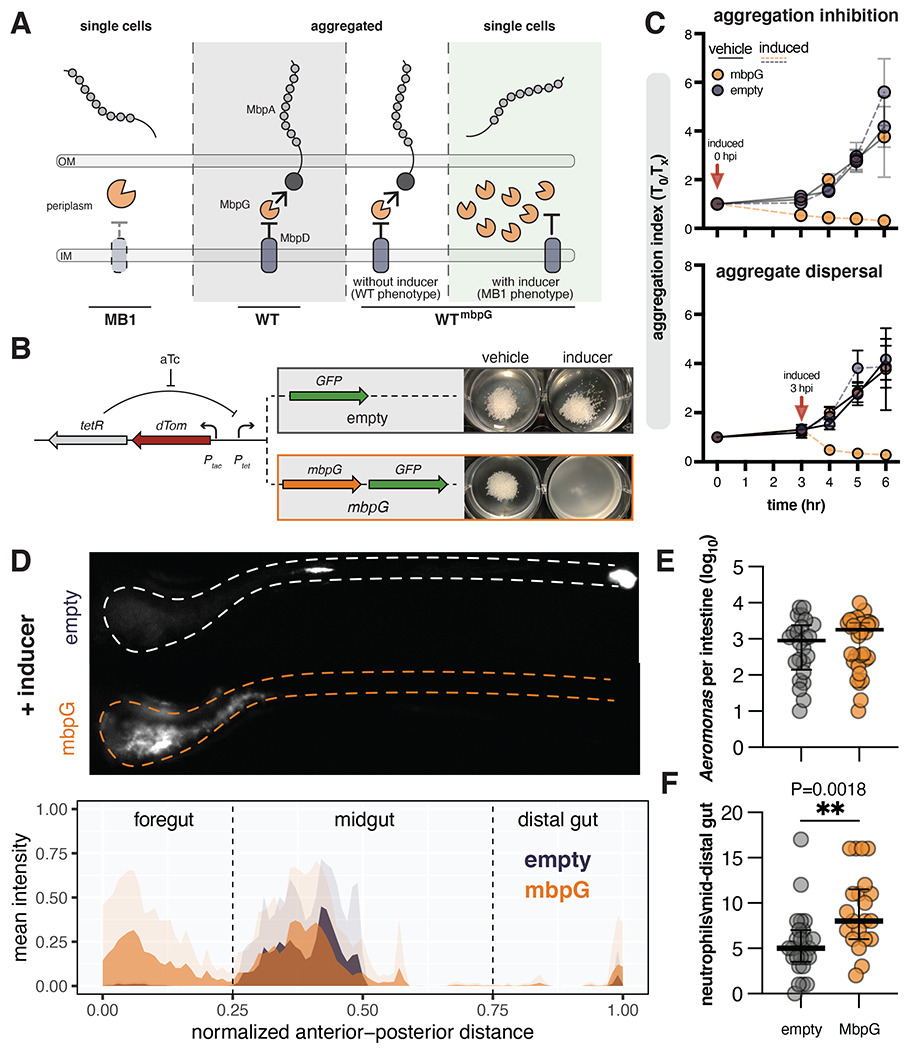
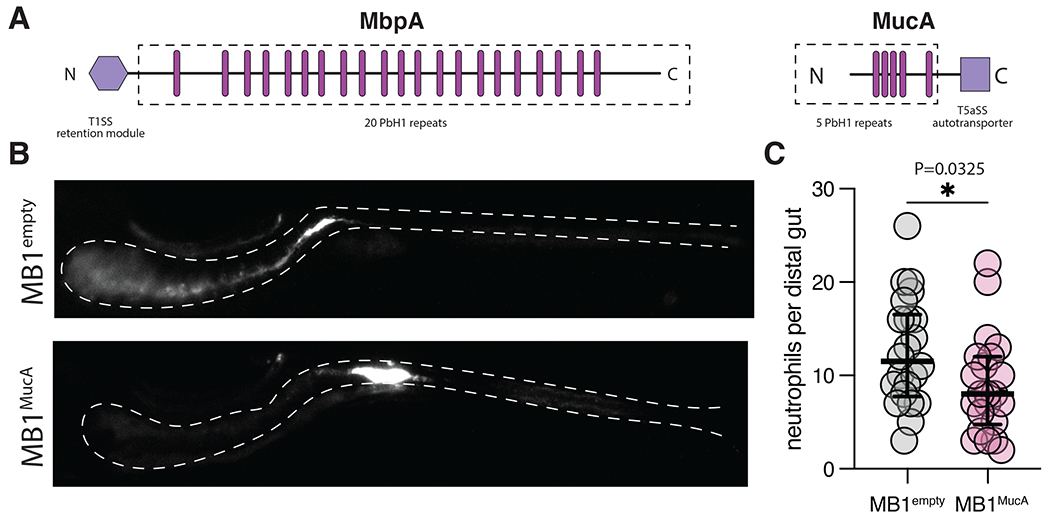
In a healthy gut, microbes are often aggregated with host mucus, yet the molecular basis for this organization and its impact on intestinal health are unclear. Mucus is a viscous physical barrier separating resident microbes from epithelia, but it also provides glycan cues that regulate microbial behaviors. Here, we describe a mucin-sensing pathway in an Aeromonas symbiont of zebrafish, Aer01. In response to the mucin-associated glycan N-acetylglucosamine, a sensor kinase regulates the expression of an aggregation-promoting adhesin we named MbpA. Upon MbpA disruption, Aer01 colonizes to normal levels but is largely planktonic and more pro-inflammatory. Increasing cell surface MbpA rescues these traits. MbpA-like adhesins are common in human-associated bacteria, and the expression of an Akkermansia muciniphila MbpA-like adhesin in MbpA-deficient Aer01 restores lumenal aggregation and reverses its pro-inflammatory character. Our work demonstrates how resident bacteria use mucin glycans to modulate behaviors congruent with host health.

Keywords: Akkermansia; adhesin; aggregation; inflammation; motility; mucin; symbiosis.


Conflict of interest statement

Declaration of interests The authors declare no competing interests.

Figures

Figure 1.
Figure 1.. Aer01 associates with host intestinal mucus and aggregates in response to its mucolytic activity.
(A-C) Confocal microscopy of fixed 5 dpf larval zebrafish intestine indicating Aer01 (anti-dTom, magenta) and mucus (WGA-488, green) distribution (a) throughout the entire larval zebrafish gut, (b) the fore/mid-gut, and (c) distal mid-gut region. See also Figure S1. (D) Experimental design of culture-based aggregation assay and calculation of aggregation index. (E) Top: representative images of mucin-and GlcNAc-mediated Aer01 aggregation after 6 hr exposure. Bottom: mean aggregation index of Aer01 exposed to PGM or its monomeric glycan components (N=3). (F) Aer01 hydrolysis of 4-Nitrophenyl (pNP) substrates. (N=5). The mean values are indicated in all figures.
Figure 2.
Figure 2.. Defects in mucin responses alter Aer01 spatial organization in the intestine.
(A) Left: Experimental evolution schematic. Right: Evolved Aer01 are non-responsive to GlcNAc. (B) Inoculation and imaging schedule for Aer01 and MB population structure analysis. (C) Live stereoscope microscopy of population-level Aer01 and MB spatial organizations. The approximate intestinal boundary is outlined and corresponds the region measured for distribution analysis in (D). (D) Quantification of bacterial spatial organization from lives images in (c). Mean pixel intensities (microbial abundance) are plotted along the normalized gut length and standard deviation at each point plotted in the corresponding lighter color. Aer01 (N=7), MB1 (N=7), MB2 (N=7), MB3 (N=5), MB4 (N=7).
Figure 3.
Figure 3.. Genomic analysis of experimentally evolved isolates reveals molecular basis for mucin-mediated aggregation defects.
(A) Chromosomal organization of MB1-MB4 mutations (red: MB1; yellow: MB2; blue: MB3; teal: MB4). The locus ID, putative function, nucleotide substation, and corresponding amino acid change listed when applicable. The ORF encoding mbpA is boxed and the amino acids corresponding to the MbpG cleavage motif in the N-terminal retention module are indicated. (B) Swim diameter of WT and MB isolates in MM alone (N=5 replicates) or supplemented with 0.4% GlcNAc (N= 5) or 1 mM proline (N=4) after 20 hr incubation at 30°C. (C) Quantification of c-di-GMP in WT, MB1, and MB4 exposed to GlcNAc. (D) Relative swim distance of Aer01 engineered to express the PDE ZOR0001_03617 upon aTc induction compared to Aer01 and MB4 carrying an empty induction construct. (E-G) RNAseq analysis of indicated genes involved in biofilm formation/aggregation and mucin scavenging following exposure to 0.4% Glucose (WT, N=3) or 0.4% GlcNAc (WT, N=3; MB1, N=3; MB4, N=2). Ordinary one-way ANOVA with multiple comparisons. See also Table S1. (H) Hydrolytic activity of WT, MB1, and MB4 on pNP-GlcNAc (N=3). (I) Suppressing c-di-GMP accumulation increases Aer01 pNP-GlcNAc hydrolysis (N=3). Mean and standard deviations are indicated in all graphs.
Figure 4.
Figure 4.. MB isolates are more planktonic in the mucus-rich lumen.
(A) Confocal microscopy showing MB1 (anti-dTom, red), MB4 (anti-dTom, blue), and mucus (WGA-488, yellow) distribution throughout the entire larval zebrafish gut. (B-C) zoom in of the fore/mid-gut indicated in A and B boxed regions. (D-F) Top: maximum intensity projections from live light sheet fluorescence microscopy of the distal foregut to proximal mid gut region of the larval zebrafish intestine showing population structures of WT, MB1, and MB4. Bottom: The probability of being in an n-cell cluster for WT, MB1, and MB4. The mean and standard deviation are indicated (WT, N=11; MB1, N=7, MB4, N=6). Two-way ANOVA with multiple comparisons to WT (*p <0.05, **p<0.01, ***p<0.0001). Scale bars=100 μm.
Figure 5.
Figure 5.. Mucin-blind isolates are more proinflammatory.
(A) Representative live fluorescence stereoscope microscopy image of Tg(MPX:GFP) larval zebrafish at 5 dpf. Arrows highlight neutrophils. (B) Schedule for assaying Aer01 abundance and host intestinal inflammation. (C) Neutrophil abundance from intestines of larval zebrafish mono-associated with the indicated Aer01 strain. Line and error bars represent median with 95% CI For all graphs each dot represents one fish; n ≥ 32 from at least 3 independent experiments. (WT, N=47; MB1, N=32; MB4, N=48). Ordinary one-way ANOVA was performed for Aeromonas abundance and neutrophils (P values: ****>0.0001, **=0.0063). (D) Intestinal abundance of WT, MB1, and MB4. Line and error bars represent median with 95% CI. WT, N=23; MB1, N=26; MB4, N=46.
Figure 6.
Figure 6.. Disruption of MbpA function alters Aer01 spatial organization and increases intestinal inflammation.
(A) Model of MbpA regulation. Middle (WT) and left (MB1): loss of the protease regulator MbpD in the MB1 mutant leads to constitutive protease activity and MbpA inactivation. Over expression of the MbpA-targeting protease MbpG in WT (WTmbpG) can overcome MbpD regulation, leading to MbpA inactivation. (B) Left: design of engineered construct to inactivate MbpA activity in WT Aer01. The addition of aTc activates expression of GFP control (empty) or mbpG and GFP (mbpG). Right: mbpG induction is sufficient to suppress GlcNAc-mediated WT Aer01 aggregation in culture. (C) Induction of mbpG inhibits GlcNAc-mediated aggregation (top) and disperses formed aggregates (bottom). N=3. (D) Inhibition of MbpA activity via mbpG induction alters WT Aer01 population structure in the intestine, leading to displacement into the foregut region. Top: representative image WT Aer01 carrying either the empty or mbpG constructs outlined in (B). Bottom: population structure analysis across the entire gut. Solid colors indicate the mean value at the normalized distance with transparent colors indicating the standard deviation. WTempty N=5; WTmbpG, N=11. (E) Intestinal abundance of WTempty and WTmbpG. Line and error bars represent median with 95% CI Unpaired t test. WTempty N=24; WTmbpG, N=34. (F) Inactivation of MbpA function increases the inflammation character of WT Aer01. Intestinal inflammation is indicated by neutrophil abundance in the mid to distal gut. Line and error bars represent median with 95% CI. Unpaired t test. WTempty, N=25; WTmbpG, N=21.
Figure 7.
Figure 7.. Expression of the Akkermansia adhesin MucA rescues MB1 population structure and reduces MB1 inflammation.
(A) Aeromonas MbpA and Akkermansia muciniphila MucA contain similar domain architectures but are secreted and regulated via distinct mechanisms (T1SS and T5aSS). The dashed boxed region indicates putative surface exposed domains, the pink bars approximate the location of each PbH1 domain as indicated by SMART analysis, and purple hexagons are the domains involved in retaining the respective adhesins at the cell surface. The size of each adhesin is scaled according to the amino acid length. (B) Expression of MucA rescues population structure defects associated with MB1 in the intestine. (D) Expression of MucA reduces intestinal inflammation associated with the MB1 evolved isolate. Neutrophil abundance was compared using an unpaired t test (N=22, each). Line and error bars represent median with 95% CI.

References

    1. Johansson MEV, Phillipson M, Petersson J, Velcich A, Holm L, and Hansson GC (2008). The inner of the two Muc2 mucin-dependent mucus layers in colon is devoid of bacteria. Proc. Natl. Acad. Sci. U. S. A 105, 15064–15069. 10.1073/pnas.0803124105. - DOI - PMC - PubMed
    1. Vaishnava S, Yamamoto M, Severson KM, Ruhn K. a, Yu X, Koren O, Ley R, Wakeland EK, and Hooper LV (2011). The Antibacterial Lectin RegIII-gamma Promotes the Spatial Segregation of Microbiota and Host in the Intestine. Science (80-.). 334, 255–258. 10.1126/science.1209791. - DOI - PMC - PubMed
    1. Schlomann BH, Wiles TJ, Wall ES, Guillemin K, and Parthasarathy R (2018). Bacterial Cohesion Predicts Spatial Distribution in the Larval Zebrafish Intestine. Biophys. J 115, 2271–2277. 10.1016/j.bpj.2018.10.017. - DOI - PMC - PubMed
    1. Wiles TJ, Wall ES, Schlomann BH, Hay EA, Parthasarathy R, and Guillemin K (2018). Modernized Tools for Streamlined Genetic Manipulation and Comparative Study of Wild and Diverse Proteobacterial Lineages. MBio 9, 1–19. 10.1128/mbio.01877-18. - DOI - PMC - PubMed
    1. Bergstrom K, Shan X, Casero D, Batushansky A, Lagishetty V, Jacobs JP, Hoover C, Kondo Y, Shao B, Gao L, et al. (2020). Proximal colon-derived O-glycosylated mucus encapsulates and modulates the microbiota. Science (80-.). 370, 467–472.10.1126/science.aay7367. - DOI - PMC - PubMed

LinkOut - more resources