. 2023 Jul 29;14(1):4566.
doi: 10.1038/s41467-023-40173-5.

Guided construction of single cell reference for human and mouse lung

Collaborators, Affiliations

Guided construction of single cell reference for human and mouse lung

Minzhe Guo et al. Nat Commun. .

Abstract

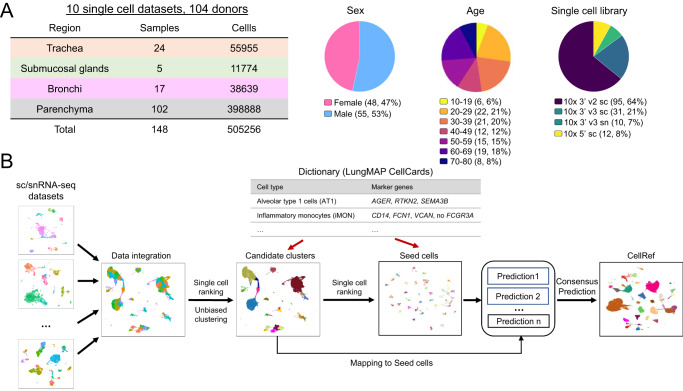
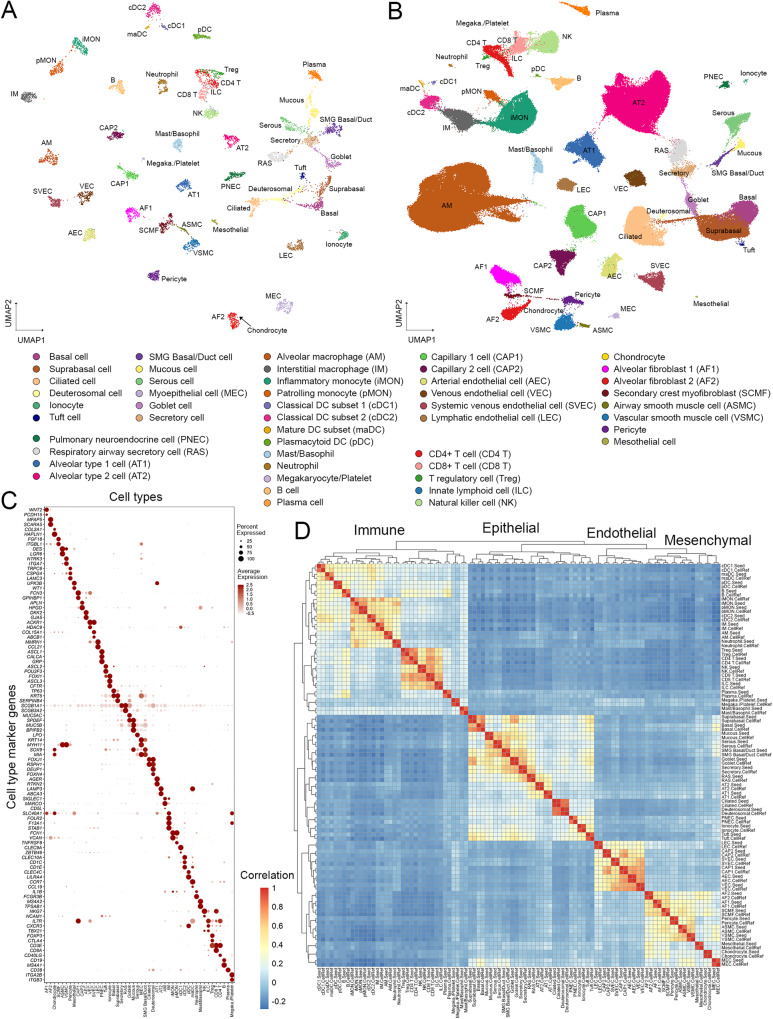
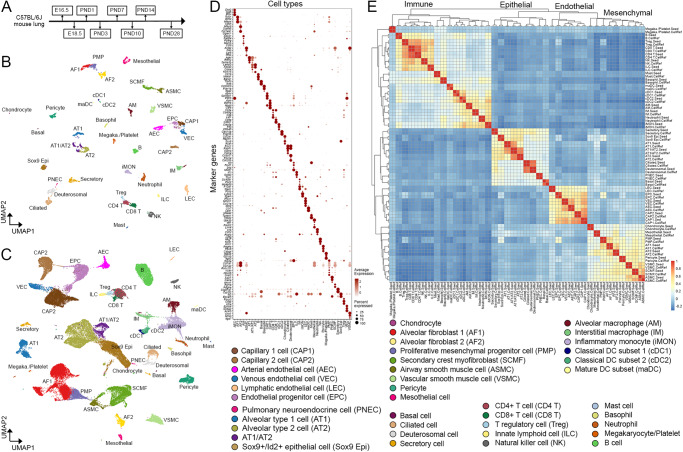
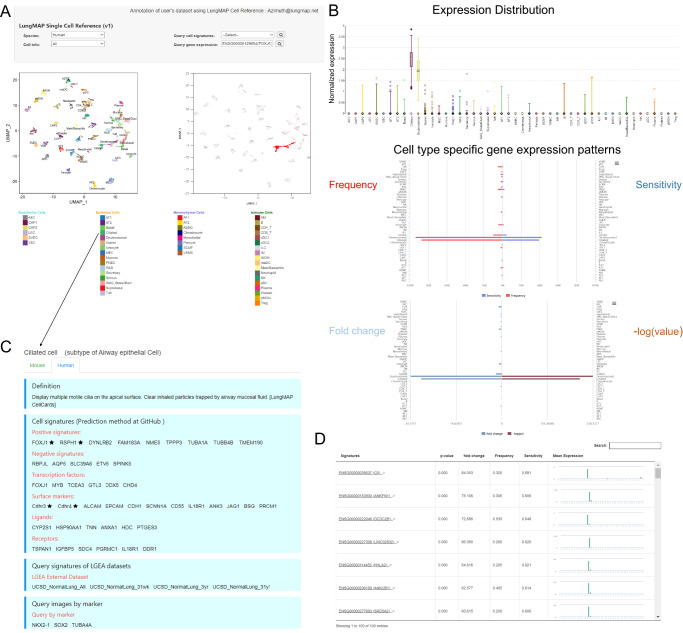
Accurate cell type identification is a key and rate-limiting step in single-cell data analysis. Single-cell references with comprehensive cell types, reproducible and functionally validated cell identities, and common nomenclatures are much needed by the research community for automated cell type annotation, data integration, and data sharing. Here, we develop a computational pipeline utilizing the LungMAP CellCards as a dictionary to consolidate single-cell transcriptomic datasets of 104 human lungs and 17 mouse lung samples to construct LungMAP single-cell reference (CellRef) for both normal human and mouse lungs. CellRefs define 48 human and 40 mouse lung cell types catalogued from diverse anatomic locations and developmental time points. We demonstrate the accuracy and stability of LungMAP CellRefs and their utility for automated cell type annotation of both normal and diseased lungs using multiple independent methods and testing data. We develop user-friendly web interfaces for easy access and maximal utilization of the LungMAP CellRefs.


Conflict of interest statement

The authors declare no competing interests.

Figures

Fig. 1
Fig. 1. Data collection and the guided single-cell reference (CellRef) construction pipeline.
A Characteristics of the collection of single cell/nucleus (sc/sn) RNA-seq datasets from normal human lung samples. B Schematic workflow for the LungMAP CellRef construction guided by using LungMAP CellCards as a cell type dictionary.
Fig. 2
Fig. 2. The construction of LungMAP Human Lung CellRef.
A Uniform manifold approximation and projection (UMAP) visualization of seed cells representing 48 lung cell types of normal human lung, termed LungMAP Human Lung CellRef Seed. Cells were colored by their predicted seed identities. B UMAP visualization of the complete single-cell reference for normal human lung, denoted as LungMAP Human Lung CellRef, which contains 347,970 cells from 104 donors and defines 48 cell types in normal human lung. Cells were colored by their predicted identities. C Validation of the seed cell identity using the expression of cell type selective marker genes derived from LungMAP CellCards. D Reconstruction of cell lineage relationships using hierarchical clustering analysis of cell type pseudo-bulk gene expression profiles. Color represents Pearson’s correlation value of pseudo-bulk expression profiles. Labels ending with “.Seed” represent pseudo-bulk profiles created by averaging gene expression in the cells of each cell type in the human lung CellRef Seed, while labels ending with “.CellRef” represent pseudo-bulk profiles created using gene expression of each cell type in the complete human lung CellRef.
Fig. 3
Fig. 3. The construction of LungMAP Mouse Lung Development CellRef.
A The developmental time points of mouse lung single-cell transcriptome data used for the guided CellRef construction. B Uniform manifold approximation and projection (UMAP) visualization of the seed cells representing 40 cell types of the developing mouse lung, termed LungMAP Mouse Lung Development CellRef Seed. Cells were colored by predicted seed identities. C UMAP visualization of CellRef for normal mouse lung development, named LungMAP Mouse Lung Development CellRef. Cells were colored by their predicted identities. D Validation of seed cell identities using expression of cell type selective marker genes. E Lineage relationships among mouse lung cell types were reconstructed using hierarchical clustering analysis using pseudo-bulk gene expression profiles. Color represents Pearson’s correlation value of pseudo-bulk expression profiles. Labels ending with “.Seed” represent pseudo-bulk profiles created by averaging gene expression in the cells of each cell type in the mouse lung CellRef Seed, while labels ending with “.CellRef” represent pseudo-bulk profiles created using gene expression of each cell type in the complete mouse lung CellRef.
Fig. 4
Fig. 4. Online interactive exploration of LungMAP CellRef Seed using Lung Gene Expression Analysis (LGEA) web portal.
The LungMAP Human Lung CellRef Seed was comprised of 8080 seed cells representing 48 normal lung cell types. A The “Gene Expression Query” interface allows users to input a gene of interest (top) and visualize of the expression of the queried gene in UMAP embeddings of cells (bottom), Colors represent the seed cell identities (bottom left) or the expression of the input gene (bottom right). B Visualization of the gene expression pattern (top: expression distribution; middle: expression frequency and sensitivity; bottom: fold change and p-value of differential expression) across all cell types in the CellRef Seed. Box center lines, bounds of the box, and whiskers indicate medians, first and third quartiles, and minimum and maximum values within 1.5×IQR (interquartile range) of the box limits, respectively. P value for each cell type was determined using a nonparametric binomial test for single-cell RNA-seq data by comparing the expression of FOXJ1 in the cell type with its expression in all other cells in the CellRef Seed. See Fig. 4 source data table for number of cells in each cell type. C LGEA hosts comprehensive cell information related with the query cell type. D “Cell Signature Query” function retrieves signature gene expression statistics of a given cell type and bar-plot visualization of signature genes expression across all cell types in the CellRef Seed. P values were determined using a nonparametric binomial test for single-cell RNA-seq data by comparing gene expression in the ciliated cells (n = 200 cells) with all other cells (n = 7880 cells) in the CellRef Seed. In (A) and (B), FOXJ1 expression was shown as example. In (C) and (D), Ciliated cells were used as example.
Fig. 5
Fig. 5. Cell type annotation and evaluation using the LungMAP Human Lung CellRef.
A Schematic workflow of the automated cell type annotation and evaluation pipeline. B Distributions of cell type prediction scores in each test data. Prediction scores using CellRef Seed (yellow bars) are comparable to those using the complete CellRef (blue bars). Prediction scores (between 0 and 1) were calculated by the Seurat v4 MapQuery function for each cell. Box center lines, bounds of the box, and whiskers indicate medians, first and third quartiles, and minimum and maximum values within 1.5×IQR (interquartile range) of the box limits, respectively. GSM5388411: 6228 cells, GSM5388412: 8329 cells, GSM5388413: 7143 cells, GSM4504966: 8381 cells, GSM4504967: 8043 cells, GSM4035472: 5767 cells. C Consistency of cell type predictions using the CellRef Seed and CellRef in each test data. Consistency percentages (y axis) were calculated for cells in each test dataset (color) passing different thresholds of prediction scores (x axis). DH Evaluation of automated cell type annotations for three of our test data (GSM5388411/12/13, three scRNA-seq of normal human lungs). Evaluation of the other three test data samples were shown in Supplementary Fig. 7. Basal and suprabasal cells were combined in prediction. D UMAP visualization of cells with prediction scores ≥ default cut-off (mean-1 standard deviation) and predicted annotations with at least 5 cells. Cells were colored by automated cell type annotations using the CellRef Seed as reference. Data from different donors were integrated using Seurat’s reciprocal principal components analysis (RPCA) pipeline. E Evaluation of cell type annotations using CellRef cell type markers from Supplementary Data 2. F Percentages of cell type markers (Supplementary Data 2) that are differentially expressed in their corresponding cell type predictions (n = 34 cell types) in (D). Data are shown using violin plot with dot and error bars representing mean ± SEM. G Heatmap visualization of expression of cell type specific differentially expressed genes (DEGs). H The number of DEGs for each predicted cell type. I Significantly enriched functional annotations using DEGs of the predicted AT2 cells: most enriched Gene Ontology Biological Processes (top) and ToppCell Gene Sets (bottom). Functional enrichment analysis was performed using ToppGene (https://toppgene.cchmc.org/enrichment.jsp). The minimum false discovery rate (FDR) was set to 1e−300. Please see Fig. 2 for definitions of cell type abbreviations.
Fig. 6
Fig. 6. Application of LungMAP Human Lung CellRef to disease lungs.
A UMAP visualization of a published scRNA-seq of human lungs with LAM. Cell colors represent cell identities predicted in Guo et al., 2020, including a unique disease-related cell population, named LAMCORE cells (magenta cell cluster). B UMAP visualizations of cells predicted using the CellRef Seed as reference. Basal and suprabasal cells were combined in the prediction. Prediction scores (between 0 and 1) were calculated by the Seurat v4 MapQuery function for each cell. Cells with prediction score >= the default cutoff (i.e., the mean minus 1 standard deviation value) were shown. Three singleton cell type predictions were not included. C Evaluation of cell type predictions using expression of representative CellRef marker genes. Megaka./Platelet: Megakaryocyte/Platelet. D Distributions of the cell type prediction scores in each of the original cell identities (n = 18 cell types; abbreviations were defined in Guo et al.). The black and red horizontal line represents the mean and (1 standard deviation lower than the mean) value of the prediction scores, respectively. EG UMAP and boxplot visualizations of application of CellRef to a published scRNA-seq of human lungs with idiopathic pulmonary fibrosis (IPF). E UMAP visualization of cells predicted using the CellRef Seed. Basal and suprabasal were combined, T cell subsets, and monocyte subsets were combined in the prediction. F UMAP visualization of cells colored by the prediction scores. G Left: UMAP visualization of cells colored by the original cell identities (n = 31 cell types; abbreviations were defined in Habermann et al.). Right: boxplot visualization of the distribution of prediction scores in each of the original cell identities. The black and red horizontal line represents the mean and (1 standard deviation lower than the mean) value of the prediction scores, respectively. The disease-associated KRT5-/KRT17+ cells had prediction scores below the cutoff line. The number of data points in each boxplot in (B) and (G) can be found in Fig. 6 source data table. In (D) and (G), Box center lines, bounds of the box, and whiskers indicate medians, first and third quartiles, and minimum and maximum values within 1.5×IQR (interquartile range) of the box limits, respectively. Please see Fig. 2 for definitions of CellRef cell type abbreviations.
Fig. 7
Fig. 7. Assessment of cell type prediction accuracy of the LungMAP Human Lung CellRef.
A Heatmap visualization of Pearson’s correlations of cell types between the human lung CellRef and the Human Lung Cell Atlas (HLCA). A pseudo-bulk profile was created for each cell type of either CellRef or HLCA by averaging each gene’s expression in the cells of the cell type. Cell types were clustered into four modules, each corresponding to one of the four major cell-lineages. Correspondences of CellRef and HLCA cell types within each of the four modules were shown based on the hierarchical clustering analysis. B, C Assessment of cell type accuracy based on marker gene expression. B Area under the receiver operating characteristic (ROC) curve (AUC) values for each of the mapped cell types (n = 42) in CellRef (orange) and HLCA (blue) calculated using the cell type selective marker genes identified from the HLCA study. Left: summary of the AUC values using violin plots. Middle: AUC values for each of the mapped cell types. Right: using CellRef AF2 (HLCA adventitial fibroblasts) as an example to show the ROC curves labeled with AUC values and 90% confidence interval. C AUCs values for each of the mapped cell types (n = 42) in the CellRef (orange) and HLCA (blue) calculated using the cell type selective marker genes identified by CellRef (Supplementary Data 5). Left: summary of the AUC values using violin plots. Middle: AUC values for each of the mapped cell types. Right: using CellRef AF2 (HLCA adventitial fibroblasts) as an example to show the ROC curves labeled with AUC values and 90% confidence interval. In both (B) and (C), the black dot and error bars represent mean ± SEM. p value represents significance of difference assessed using two-tailed paired Welch’s t test. CellRef cell type abbreviations are described in Fig. 2.
Fig. 8
Fig. 8. Assessment of cell type stability of automated annotation using CellRef.
A, B UMAP projection of scRNA-seq (Travaglini et al., n = 3 human lungs) with Azimuth projected cell type annotations using the LungMAP Human Lung CellRef Seed (A) or using the Human Lung Cell Atlas (HLCA) (B) as the reference. C Corresponding cell-population assignments of CellRef and HLCA (mapping percentage relative to CellRef). D Cells colored by “winning” annotations from CellRef or HLCA determined by scTriangulate based on stability assessments (shown in E) annotations. E Violin plot visualization of stability metric scores calculated using scTriangulate, including reclassification accuracy (SCCAF and reassign) or marker gene specificity (TF-IDF score), for all Azimuth assigned CellRef or HLCA cell populations (n = 42 cell populations predicted using the CellRef Seed; n = 48 cell populations predicted using HLCA) in Travaglini et al. 2020. The black dots and error bars represent mean ± SEM. p value represents significance of difference assessed using two-tailed unpaired Welch’s t test. Please see Fig. 2 for definitions of CellRef cell type abbreviations.

References

    1. Guo M, et al. Single-cell transcriptomic analysis identifies a unique pulmonary lymphangioleiomyomatosis cell. Am. J. Respir. Crit. Care Med. 2020;202:1373–1387. doi: 10.1164/rccm.201912-2445OC. - DOI - PMC - PubMed
    1. Wang, A. et al. Single-cell multiomic profiling of human lungs reveals cell-type-specific and age-dynamic control of SARS-CoV2 host genes. Elife9, 10.7554/eLife.62522 (2020). - PMC - PubMed
    1. Melms JC, et al. A molecular single-cell lung atlas of lethal COVID-19. Nature. 2021;595:114–119. doi: 10.1038/s41586-021-03569-1. - DOI - PMC - PubMed
    1. Basil, M. C. et al. Human distal airways contain a multipotent secretory cell that can regenerate alveoli. Nature10.1038/s41586-022-04552-0 (2022). - PMC - PubMed
    1. Hao Y, et al. Integrated analysis of multimodal single-cell data. Cell. 2021;184:3573–3587.e3529. doi: 10.1016/j.cell.2021.04.048. - DOI - PMC - PubMed

Publication types