

Encapsulation and adhesion of nanoparticles as a potential biomarker for TNBC cells metastatic propensity
- PMID: 37516753
- PMCID: PMC10387085
- DOI: 10.1038/s41598-023-33540-1
Encapsulation and adhesion of nanoparticles as a potential biomarker for TNBC cells metastatic propensity
Abstract
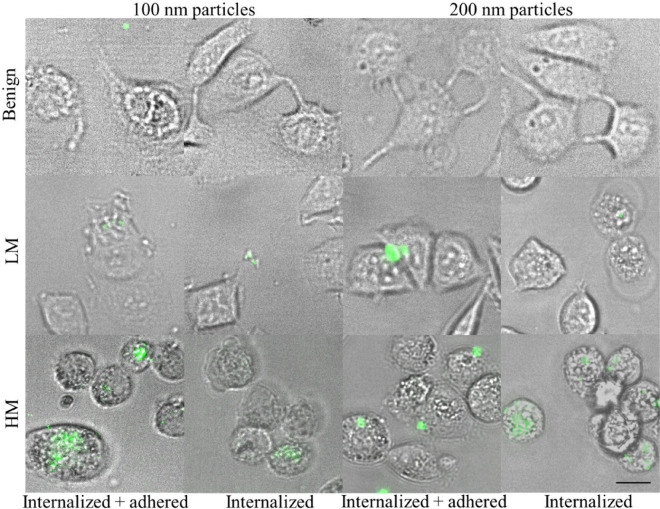
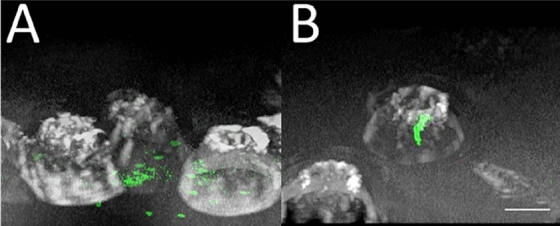
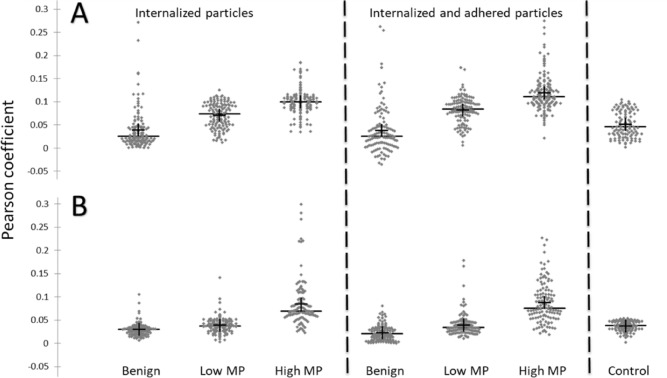
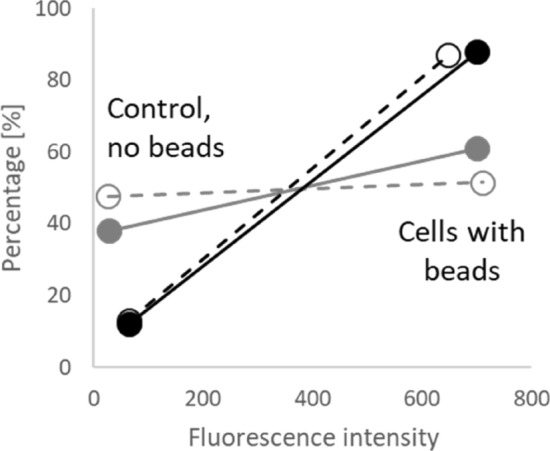
Metastasis is the main cause of cancer-related mortality; therefore, the ability to predict its propensity can remarkably affect survival rate. Metastasis development is predicted nowadays by lymph-node status, tumor size, histopathology, and genetic testing. However, all these methods may have inaccuracies, and some require weeks to complete. Identifying novel prognostic markers will open an essential source for risk prediction, possibly guiding to elevated patient treatment by personalized strategies. Cancer cell invasion is a critical step in metastasis. The cytoskeletal mechanisms used by metastatic cells for the invasion process are very similar to the utilization of actin cytoskeleton in the endocytosis process. In the current study, the adhesion and encapsulation efficiency of low-cost carboxylate-modified fluorescent nanoparticles by breast cancer cells with high (HM) and low metastatic potential (LM) have been evaluated; benign cells were used as control. Using high-content fluorescence imaging and analysis, we have revealed (within a short time of 1 h), that efficiency of nanoparticles adherence and encapsulation is sufficiently higher in HM cells compared to LM cells, while benign cells are not encapsulating or adhering the particles during experiment time at all. We have utilized custom-made automatic image analysis algorithms to find quantitative co-localization (Pearson's coefficients) of the nanoparticles with the imaged cells. The method proposed here is straightforward; it does not require especial equipment or expensive materials nor complicated cell manipulations, it may be potentially applicable for various cells, including patient-derived cells. Effortless and quantitative determination of the metastatic likelihood has the potential to be performed using patient-specific biopsy/surgery sample, which will directly influence the choice of protocols for cancer patient's treatment and, as a result, increase their life expectancy.
© 2023. The Author(s).
Conflict of interest statement
The authors declare no competing interests.
Figures

References
-
- Mohler JL, Partin AW, Isaacs JT, Coffey DS. Metastatic potential prediction by a visual grading system of cell motility: prospective validation in the Dunning R-3327 prostatic adenocarcinoma model. Cancer Res. 1988;48:4312–4317. - PubMed
Publication types
MeSH terms
Substances
LinkOut - more resources
Full Text Sources
