. 2023 Jul 29;13(1):12305.
doi: 10.1038/s41598-023-39426-6.

In vitro infection efficiency of nervous necrosis virus alters depending on amount of viral particles adsorbed onto cells

Affiliations

In vitro infection efficiency of nervous necrosis virus alters depending on amount of viral particles adsorbed onto cells

Han Sol Lee et al. Sci Rep. .

Abstract

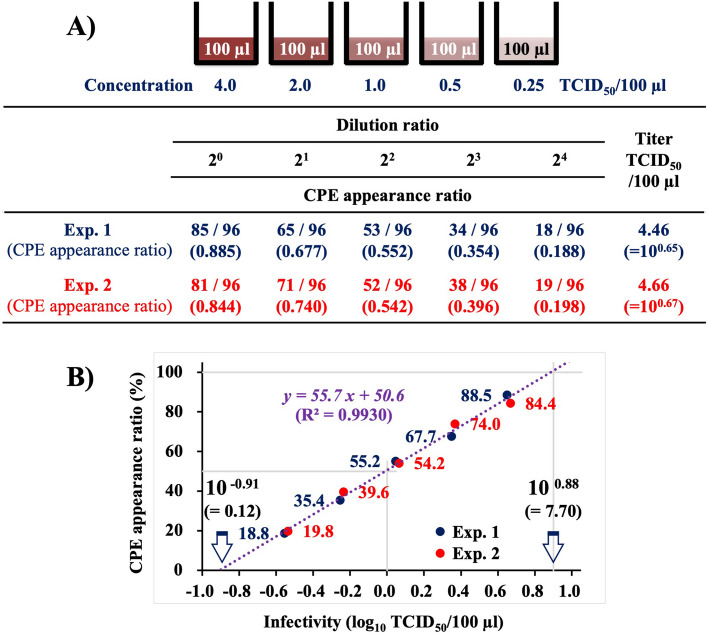
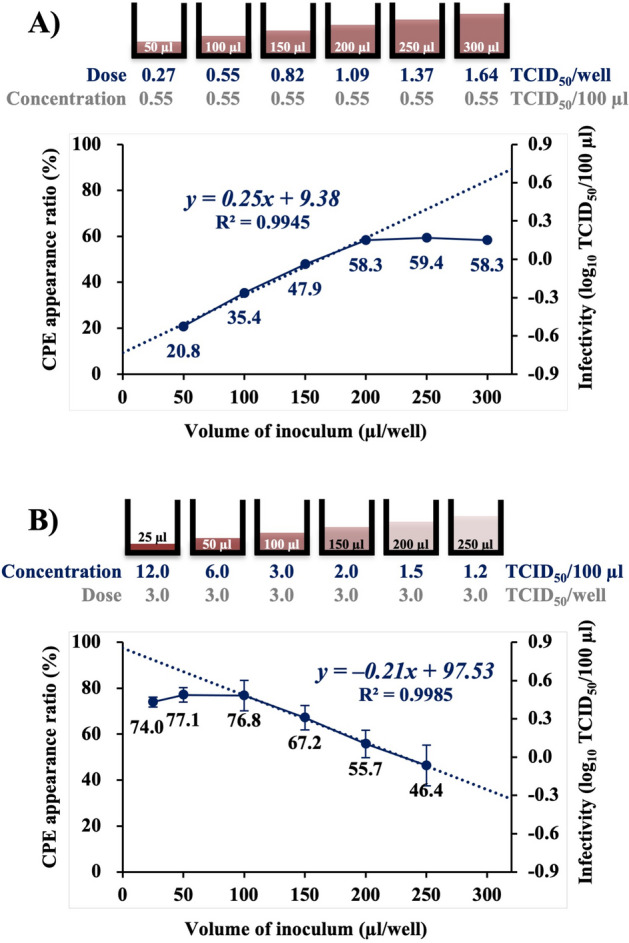
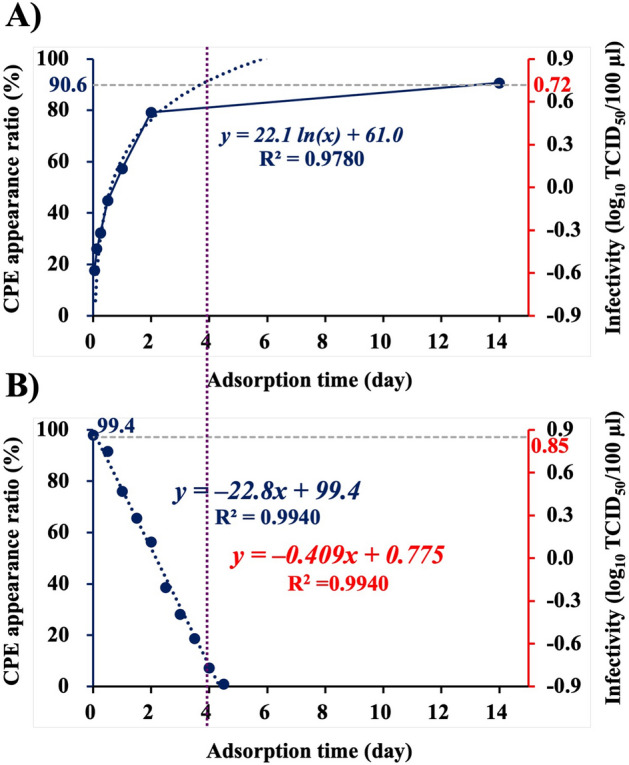
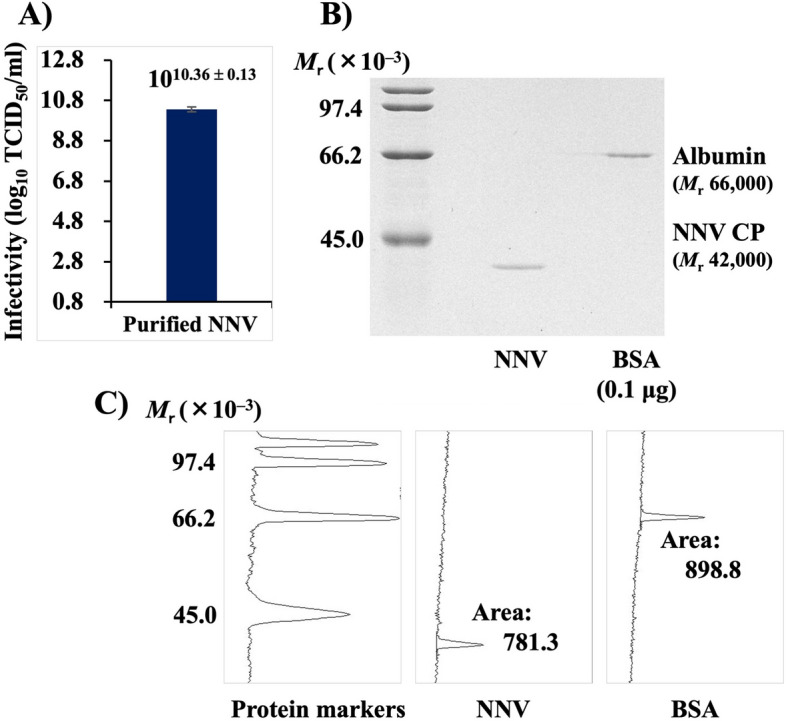
Nervous necrosis virus (NNV) in the family Nodaviridae is one of the simplest spherical RNA viruses and is pathogenic to many fish species. We investigated the effect of purified NNV on striped snakehead cells (SSN-1) in terms of adsorption ratio and infection efficiency using the 96-well titration system. The proportion of cytopathic effect (CPE)-positive wells among total number of wells inoculated with the virus (CPE appearance ratio) reduced by 17% each time the NNV infectivity dose was halved (y = 55.7x + 50.6). Thus, subtle differences in NNV infectivity could be accurately detected using this system. Experiments performed to observe alteration of CPE appearance ratio with changing viral doses and adsorption times showed that NNV particles introduced into microplate wells as suspensions in ≤ 100 µl inoculum were adsorbed almost completely onto cells seeded on the wells within 4 days of incubation. Density profile analysis of NNV coat proteins revealed that the NNV suspension at 1 50% tissue culture infectious dose (TCID50) contained 60 particles. Infection efficiency/NNV peaked at 20 particles (1.20%/particle) and then declined gradually with increasing NNV doses. Therefore, in vitro infection efficiency of NNV may alter depending on the quantity of viral particles adsorbed onto cells.


Conflict of interest statement

The authors declare no competing interests.

Figures

Figure 1
Figure 1
Correlation of NNV infectivity with CPE appearance ratio demonstrated by titration using the 96-well system. (A) CPE appearance ratio in serially two-fold diluted NNV at approximately 4 TCID50/100 µl. The experiment was replicated twice. (B) Semilogarithmic graph showing CPE appearance ratio (%) on the Y axis and the NNV infectivity titer (log10 TCID50/100 µl) on the X axis. NNV, nervous necrosis virus; CPE, cytopathic effect; TCID50, 50% tissue culture infectious dose.
Figure 2
Figure 2
Effect of NNV inoculum volume in CPE appearance ratio. (A) Alteration in CPE appearance ratio by inoculating with NNV samples of different volumes and same concentration. Varying volumes (50, 100, 150, 200, 250 and 300 µl) of NNV suspension at 0.55 TCID50/100 µl were inoculated onto SSN-1 cells seeded on 96-well microplates. (B) Alteration in CPE appearance ratio by inoculating with NNV samples of different volumes and constant dose. NNV suspensions at 12, 6.0, 3.0, 2.0, 1.5 and 1.2 TCID50/100 µl were prepared and inoculated to SSN-1 cells seeded on 96-well microplates each by 25, 50, 100, 150, 200 and 250 µl, respectively. Therefore, NNV inoculum dose was constantly 3.0 TCID50/well. CPE appearance ration was observed after incubation at 25 °C for 2 weeks. NNV, nervous necrosis virus; CPE, cytopathic effect; TCID50, 50% tissue culture infectious dose.
Figure 3
Figure 3
Alteration of CPE appearance ratio and infectivity of NNV depending on adsorption times. (A) Alteration of CPE appearance ratio depending on NNV-adsorption time. NNV at 5.25 TCID50/100 µl was inoculated and adsorption after 1, 3, 6, 12, 24 and 48 h and then after 2 weeks with and without washing was observed. (B) Infectivity alteration of NNV that remained in culture supernatant depending on NNV adsorption time. NNV at 101.7 TCID50/100 µl was inoculated to SSN-1 cells seeded on 96-well microplates. After every 12 h of adsorption, the NNV inoculum was harvested and inoculated to fresh cells to measure infectivity of NNV that remained in culture supernatant. NNV, nervous necrosis virus; CPE, cytopathic effect; TCID50, 50% tissue culture infectious dose.
Figure 4
Figure 4
Density profile of digital images of NNV CPs in SDS–polyacrylamide gel. (A) Infectivity titer of purified NNV suspension. (B) SDS–polyacrylamide gel electrophoresis of purified NNV suspension and BSA. Gel proteins were stained with CBB. NNV suspension and BSA solution (20 µg/ml) were loaded at the rate of 5 µl/lane. An untrimmed photograph of this gel is shown in Fig. S3. (C) Density profiles for digital images of NNV CP, BSA and protein markers. Areas of peaks for NNV CP and BSA (20 µg/ml) were 781.3 and 898.8, respectively. NNV, nervous necrosis virus; CP, coat protein; SDS, sodium dodecyl sulfate; BSA, bovine serum albumin; CBB, Coomassie brilliant blue.
Figure 5
Figure 5
Alteration of infection efficiency of NNV particles adsorbed onto cells. (A) Graph showing CPE appearance ratio (%) on the 1st Y axis, infection efficiency/TCID50 (%/TCID50) on the 2nd Y axis, and infectious dose (TCID50) on the X axis. The blue broken line is a regression curve (y = 24.2 ln[x] + 50.6), which indicates that each time NNV infectious dose is halved, CPE appearance ratio reduces by 17%. The data shown in Fig. 1B are replotted to this graph. The green broken curve indicates infection efficiency/NNV infectious dose (%/TCID50), which was estimated as follows: y = (24.2 ln[x] + 50.6)/x of NNV infectivity. Infection efficiency of NNV per TCID50 (%/TCID50) peaked at 0.34 TCID50 (72.1%/TCID50). (B) Graph showing CPE appearance ratio (%) on the 1st Y axis, %/particle on the 2nd Y axis, and NNV particle dose on the X axis. The data shown in (A) were re-evaluated based on the results that 1 TCID50 contains 60 particles and replotted to this graph. The red broken curve indicates infection efficiency/NNV particle (%/particle), which was calculated as follows: y = (24.2 ln[x] − 48.5)/x of NNV particle dose. Infection efficiency/NNV particle (%/particle) peaked at 20 particles (1.18%/particle). NNV, nervous necrosis virus; CPE, cytopathic effect; TCID50, 50% tissue culture infectious dose.

References

    1. Schneemann A, Ball LA, Delserrt C, Johnson JE, Nishizawa T. Virus taxonomy. In: Fauquet CM, Mayo MA, Maniloff J, Desselberger U, Ball LA, editors. Eighth report of the International Committee on Taxonomy of Viruses. Elsevier Academic Press; 2005.
    1. Munday BL, Kwang J, Moody N. Betanodavirus infections of teleost fish: A review. J. Fish Dis. 2002;25:127–142. doi: 10.1046/j.1365-2761.2002.00350.x. - DOI
    1. Costa JZ, Thompson KD. Understanding the interaction between Betanodavirus and its host for the development of prophylactic measures for viral encephalopathy and retinopathy. Fish Shellfish Immunol. 2016;53:35–49. doi: 10.1016/j.fsi.2016.03.033. - DOI - PubMed
    1. Bandín I, Souto S. Betanodavirus and VER Disease: A 30-year research review. Pathogens. 2020;9:106. doi: 10.3390/pathogens9020106. - DOI - PMC - PubMed
    1. Frerichs GN, Rodger HD, Peric Z. Cell culture isolation of piscine neuropathy nodavirus from juvenile sea bass. Dicentrarchus labrax. J. Gen. Virol. 1996;77:2067–2071. doi: 10.1099/0022-1317-77-9-2067. - DOI - PubMed

Publication types

Supplementary concepts